QUESTION IMAGE
Question
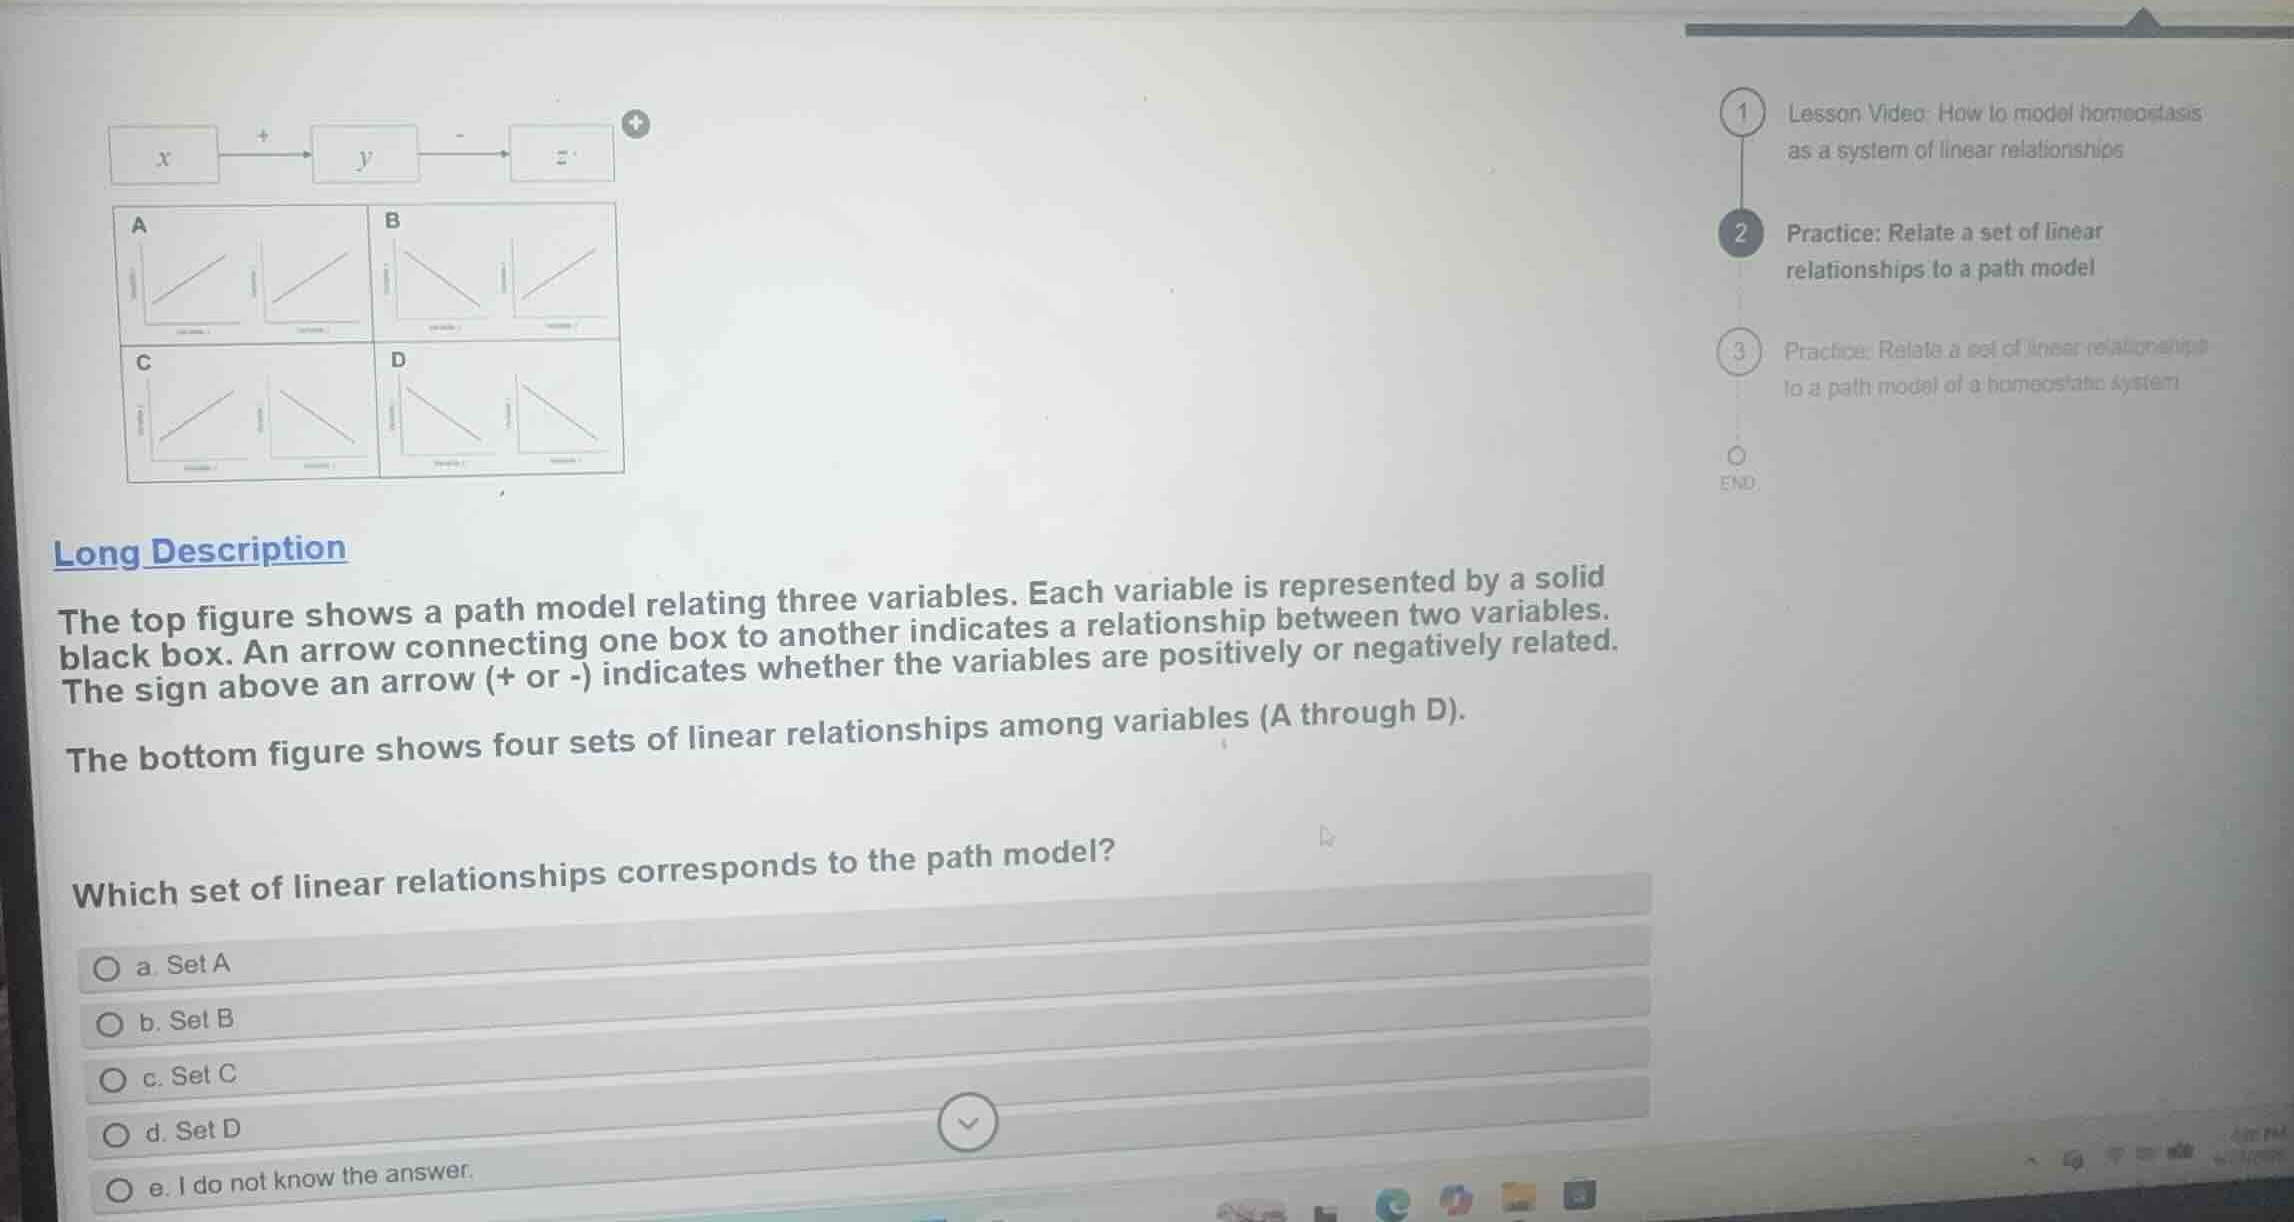
the top figure shows a path model relating three variables. each variable is represented by a solid black box. an arrow connecting one box to another indicates a relationship between two variables. the sign above an arrow (+ or -) indicates whether the variables are positively or negatively related.
the bottom figure shows four sets of linear relationships among variables (a through d).
which set of linear relationships corresponds to the path model?
a. set a
b. set b
c. set c
d. set d
e. i do not know the answer.
Analyze the path model relationships
Using the Path Models and Linear Relationships knowledge points
Match with the given sets of graphs
Using the Linear Relationships knowledge point

Snap & solve any problem in the app
Get step-by-step solutions on Sovi AI
Photo-based solutions with guided steps
Explore more problems and detailed explanations
- a. Set A
- b. Set B
- c. Set C (Correct answer)
- d. Set D
- e. I do not know the answer.