QUESTION IMAGE
Question
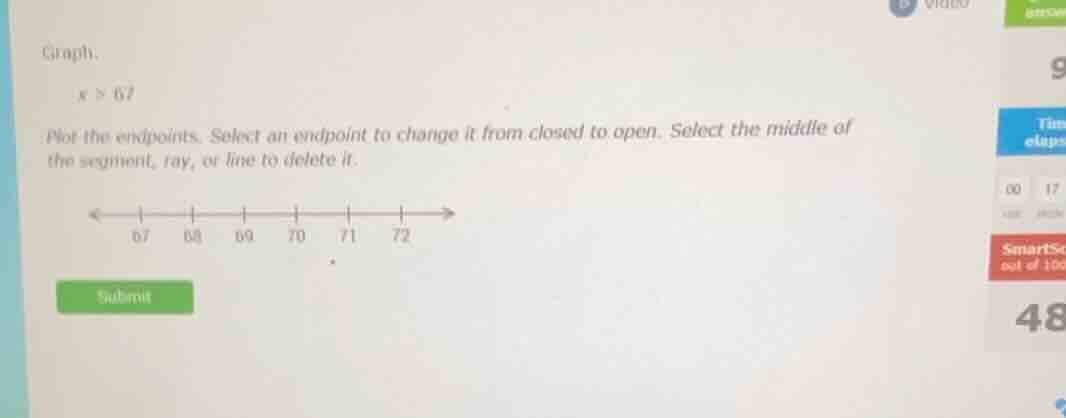
graph.
(x > 67)
plot the endpoints. select an endpoint to change it from closed to open. select the middle of the segment, ray, or line to delete it.
<pre_analysis>
{
"quality": "clear",
"question_count": 1,
"skills_matched": [
"step_cot",
"explain_then_answer",
"quick"
],
"needs_drawing": true,
"concepts_used": [
"Linear Inequalities",
"Number Line Graphing"
],
"new_concepts": [],
"current_concepts": [
"Linear Inequalities",
"Number Line Graphing"
]
}
</pre_analysis>
<reasoning>
Identify the inequality and boundary point
\[
x > 67
\]
Determine the endpoint style
\[
\text{Strict inequality } (>) \implies \text{Open circle at } x = 67
\]
Determine the direction of the ray
\[
x > 67 \implies \text{Shade to the right of } 67
\]
</reasoning>
<answer>
To graph the inequality \(x > 67\) on the number line:
- Place an open circle at \(67\).
- Draw a ray pointing to the right from \(67\).
</answer>
<plot>
{
"elements": [
{
"type": "bentinequality",
"params": [
{
"x": 67,
"operator": ">",
"labelText": "x > 67"
}
],
"properties": {
"strokeColor": "#8C55F2",
"strokeWidth": 3
}
}
]
}
</plot>
<post_analysis>
{
"subject": "Mathematics",
"question_type": "Free Response",
"knowledge_point": [
"Mathematics",
"Algebra",
"Linear Inequalities"
]
}
</post_analysis>

Snap & solve any problem in the app
Get step-by-step solutions on Sovi AI
Photo-based solutions with guided steps
Explore more problems and detailed explanations
<pre_analysis>
{
"quality": "clear",
"question_count": 1,
"skills_matched": [
"step_cot",
"explain_then_answer",
"quick"
],
"needs_drawing": true,
"concepts_used": [
"Linear Inequalities",
"Number Line Graphing"
],
"new_concepts": [],
"current_concepts": [
"Linear Inequalities",
"Number Line Graphing"
]
}
</pre_analysis>
<reasoning>
Identify the inequality and boundary point
\[
x > 67
\]
Determine the endpoint style
\[
\text{Strict inequality } (>) \implies \text{Open circle at } x = 67
\]
Determine the direction of the ray
\[
x > 67 \implies \text{Shade to the right of } 67
\]
</reasoning>
<answer>
To graph the inequality \(x > 67\) on the number line:
- Place an open circle at \(67\).
- Draw a ray pointing to the right from \(67\).
</answer>
<plot>
{
"elements": [
{
"type": "bentinequality",
"params": [
{
"x": 67,
"operator": ">",
"labelText": "x > 67"
}
],
"properties": {
"strokeColor": "#8C55F2",
"strokeWidth": 3
}
}
]
}
</plot>
<post_analysis>
{
"subject": "Mathematics",
"question_type": "Free Response",
"knowledge_point": [
"Mathematics",
"Algebra",
"Linear Inequalities"
]
}
</post_analysis>