QUESTION IMAGE
Question
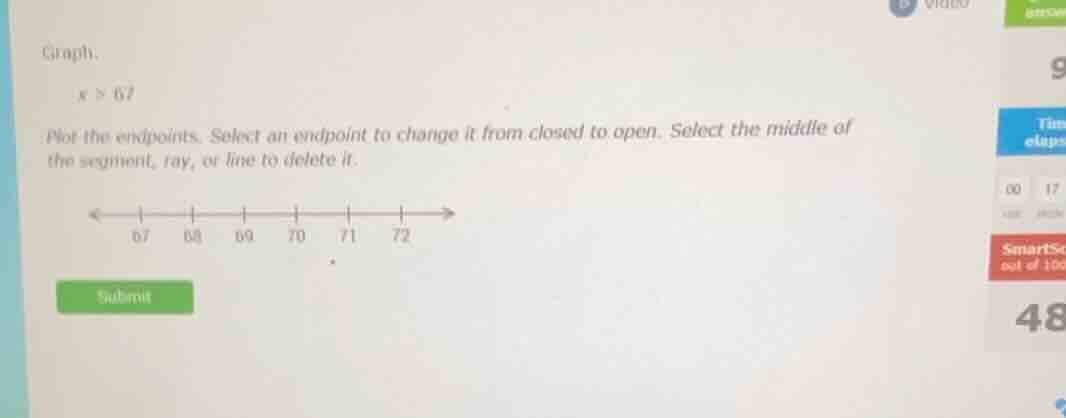
graph.
(x > 67)
plot the endpoints. select an endpoint to change it from closed to open. select the middle of the segment, ray, or line to delete it.
Identify the inequality and boundary point
$$
x > 67
$$
Determine the endpoint style
$$
\text{Strict inequality } (>) \implies \text{Open circle at } x = 67
$$
Determine the direction of the ray
$$
x > 67 \implies \text{Shade to the right of } 67
$$

Snap & solve any problem in the app
Get step-by-step solutions on Sovi AI
Photo-based solutions with guided steps
Explore more problems and detailed explanations
To graph the inequality \(x > 67\) on the number line:
- Place an open circle at \(67\).
- Draw a ray pointing to the right from \(67\).