QUESTION IMAGE
Question
select the correct answer from each drop-down menu.
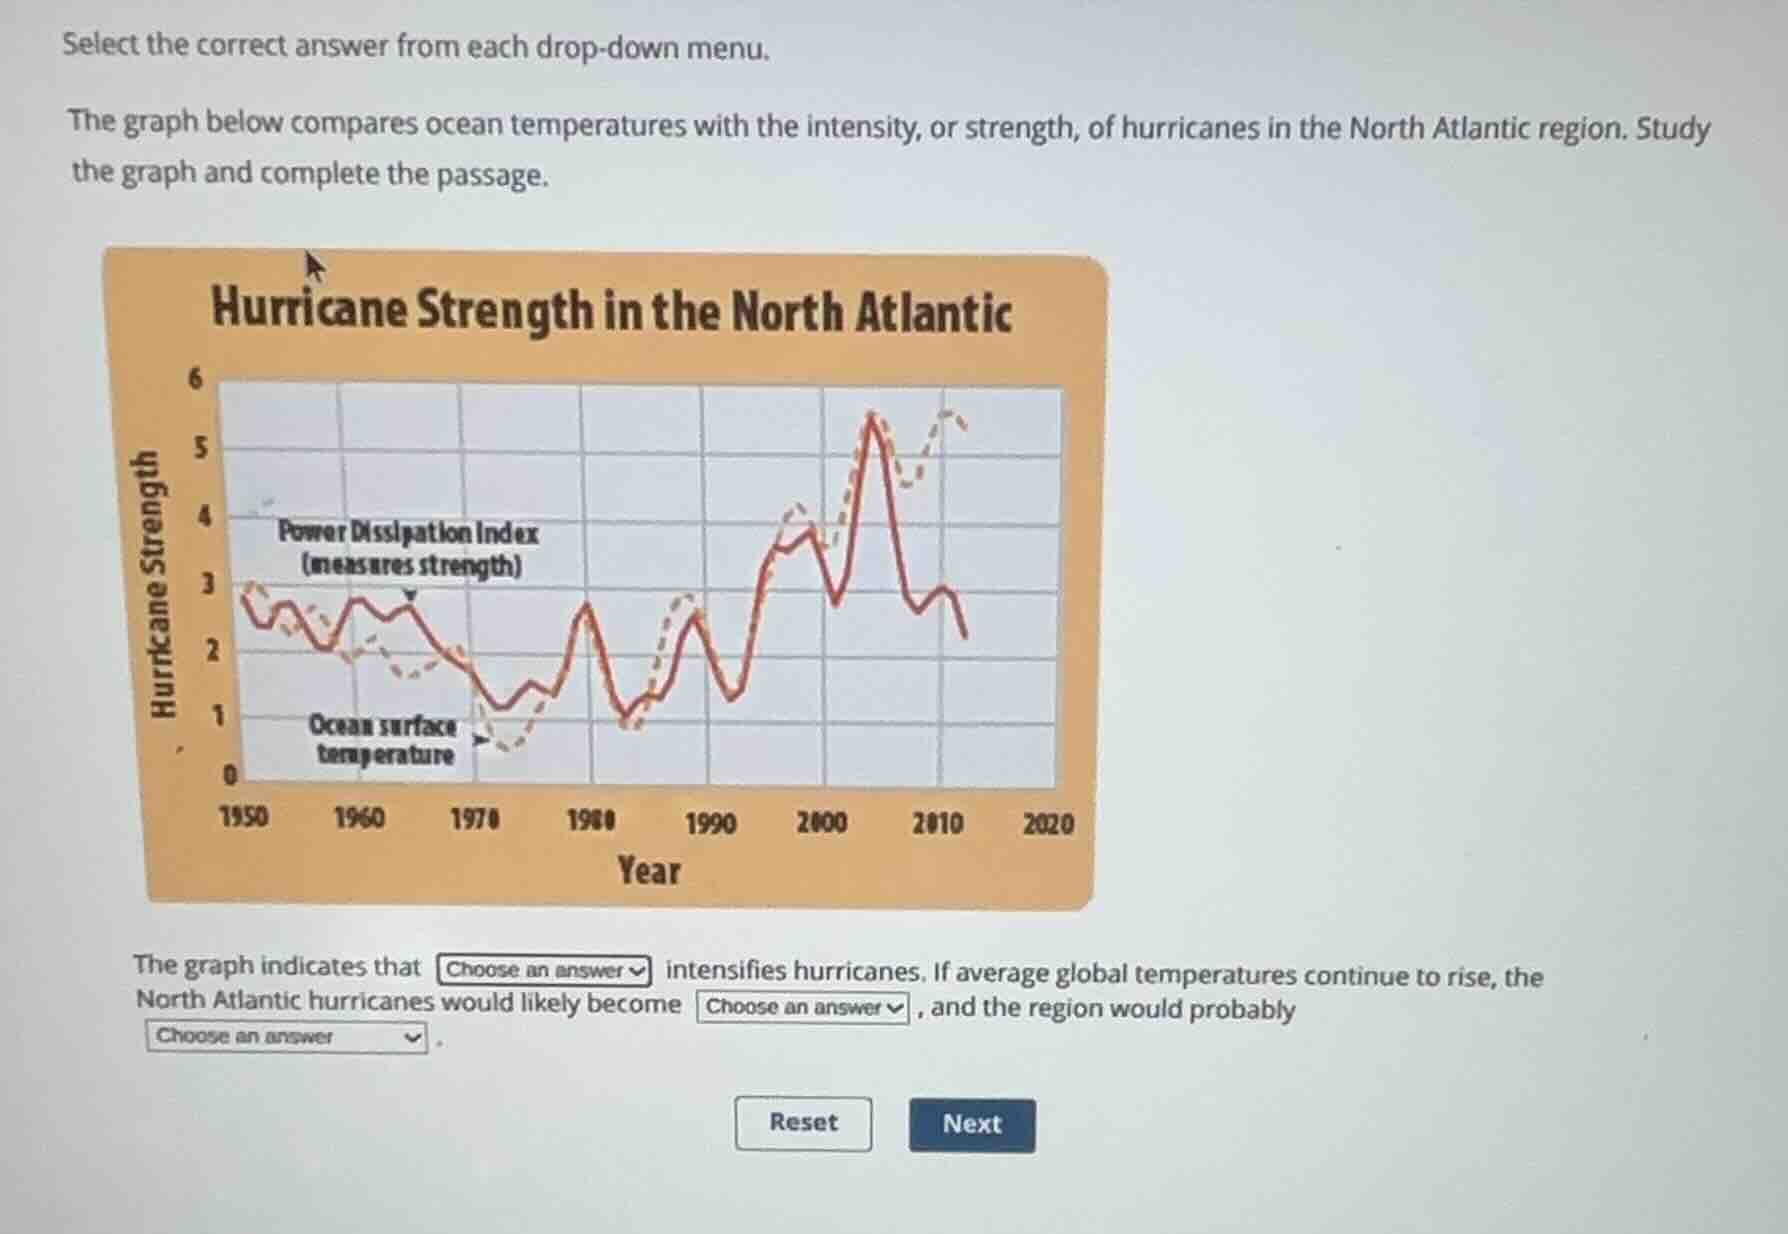
the graph below compares ocean temperatures with the intensity, or strength, of hurricanes in the north atlantic region. study the graph and complete the passage.
the graph indicates that choose an answer intensifies hurricanes. if average global temperatures continue to rise, the north atlantic hurricanes would likely become choose an answer, and the region would probably choose an answer.
Analizar la correlación en el gráfico
Determinar el efecto del aumento de temperatura
Proyectar tendencias futuras y consecuencias regionales

Snap & solve any problem in the app
Get step-by-step solutions on Sovi AI
Photo-based solutions with guided steps
Explore more problems and detailed explanations
El gráfico indica que <blank>el aumento de la temperatura de la superficie del océano</blank> intensifica los huracanes. Si las temperaturas globales promedio continúan aumentando, los huracanes del Atlántico Norte probablemente se volverían <blank>más fuertes</blank>, y la región probablemente <blank>experimentaría mayores daños por tormentas</blank>.