QUESTION IMAGE
Question
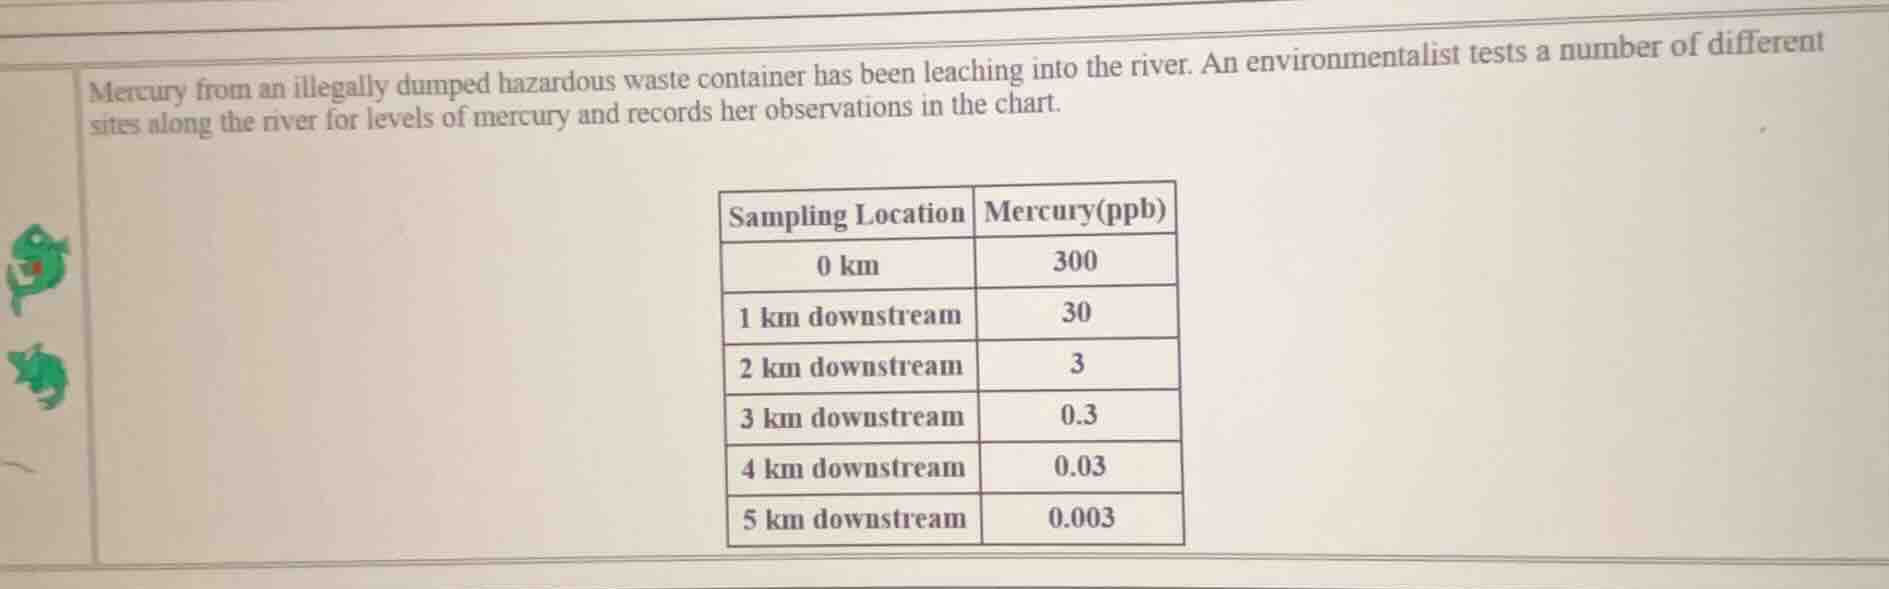
mercury from an illegally dumped hazardous waste container has been leaching into the river. an environmentalist tests a number of different sites along the river for levels of mercury and records her observations in the chart.
\
Identify the variables and data points
Let \(x\) represent the distance downstream in kilometers (\(\text{km}\)).
Let \(y\) represent the mercury concentration in parts per billion (\(\text{ppb}\)).
The given data points \((x, y)\) from the table are:
- \((0, 300)\)
- \((1, 30)\)
- \((2, 3)\)
- \((3, 0.3)\)
- \((4, 0.03)\)
- \((5, 0.003)\)
Determine the relationship pattern
Observe the ratio of consecutive mercury concentration values:
Since the concentration decreases by a factor of \(10\) for each \(1\text{ km}\) increase in distance, the relationship is exponential.
Formulate the exponential decay equation
The general form of an exponential decay function is:
Using the initial value at \(x = 0\):
Using the decay factor determined from the ratio:
Thus, the equation modeling the mercury concentration is:
Express in base 10 notation
We can also write the equation using base \(10\):
This equation perfectly models the concentration of mercury as a function of distance downstream.

Snap & solve any problem in the app
Get step-by-step solutions on Sovi AI
Photo-based solutions with guided steps
Explore more problems and detailed explanations
The relationship between the sampling location distance downstream \(x\) (in \(\text{km}\)) and the mercury concentration \(y\) (in \(\text{ppb}\)) is modeled by the exponential decay equation: