QUESTION IMAGE
Question
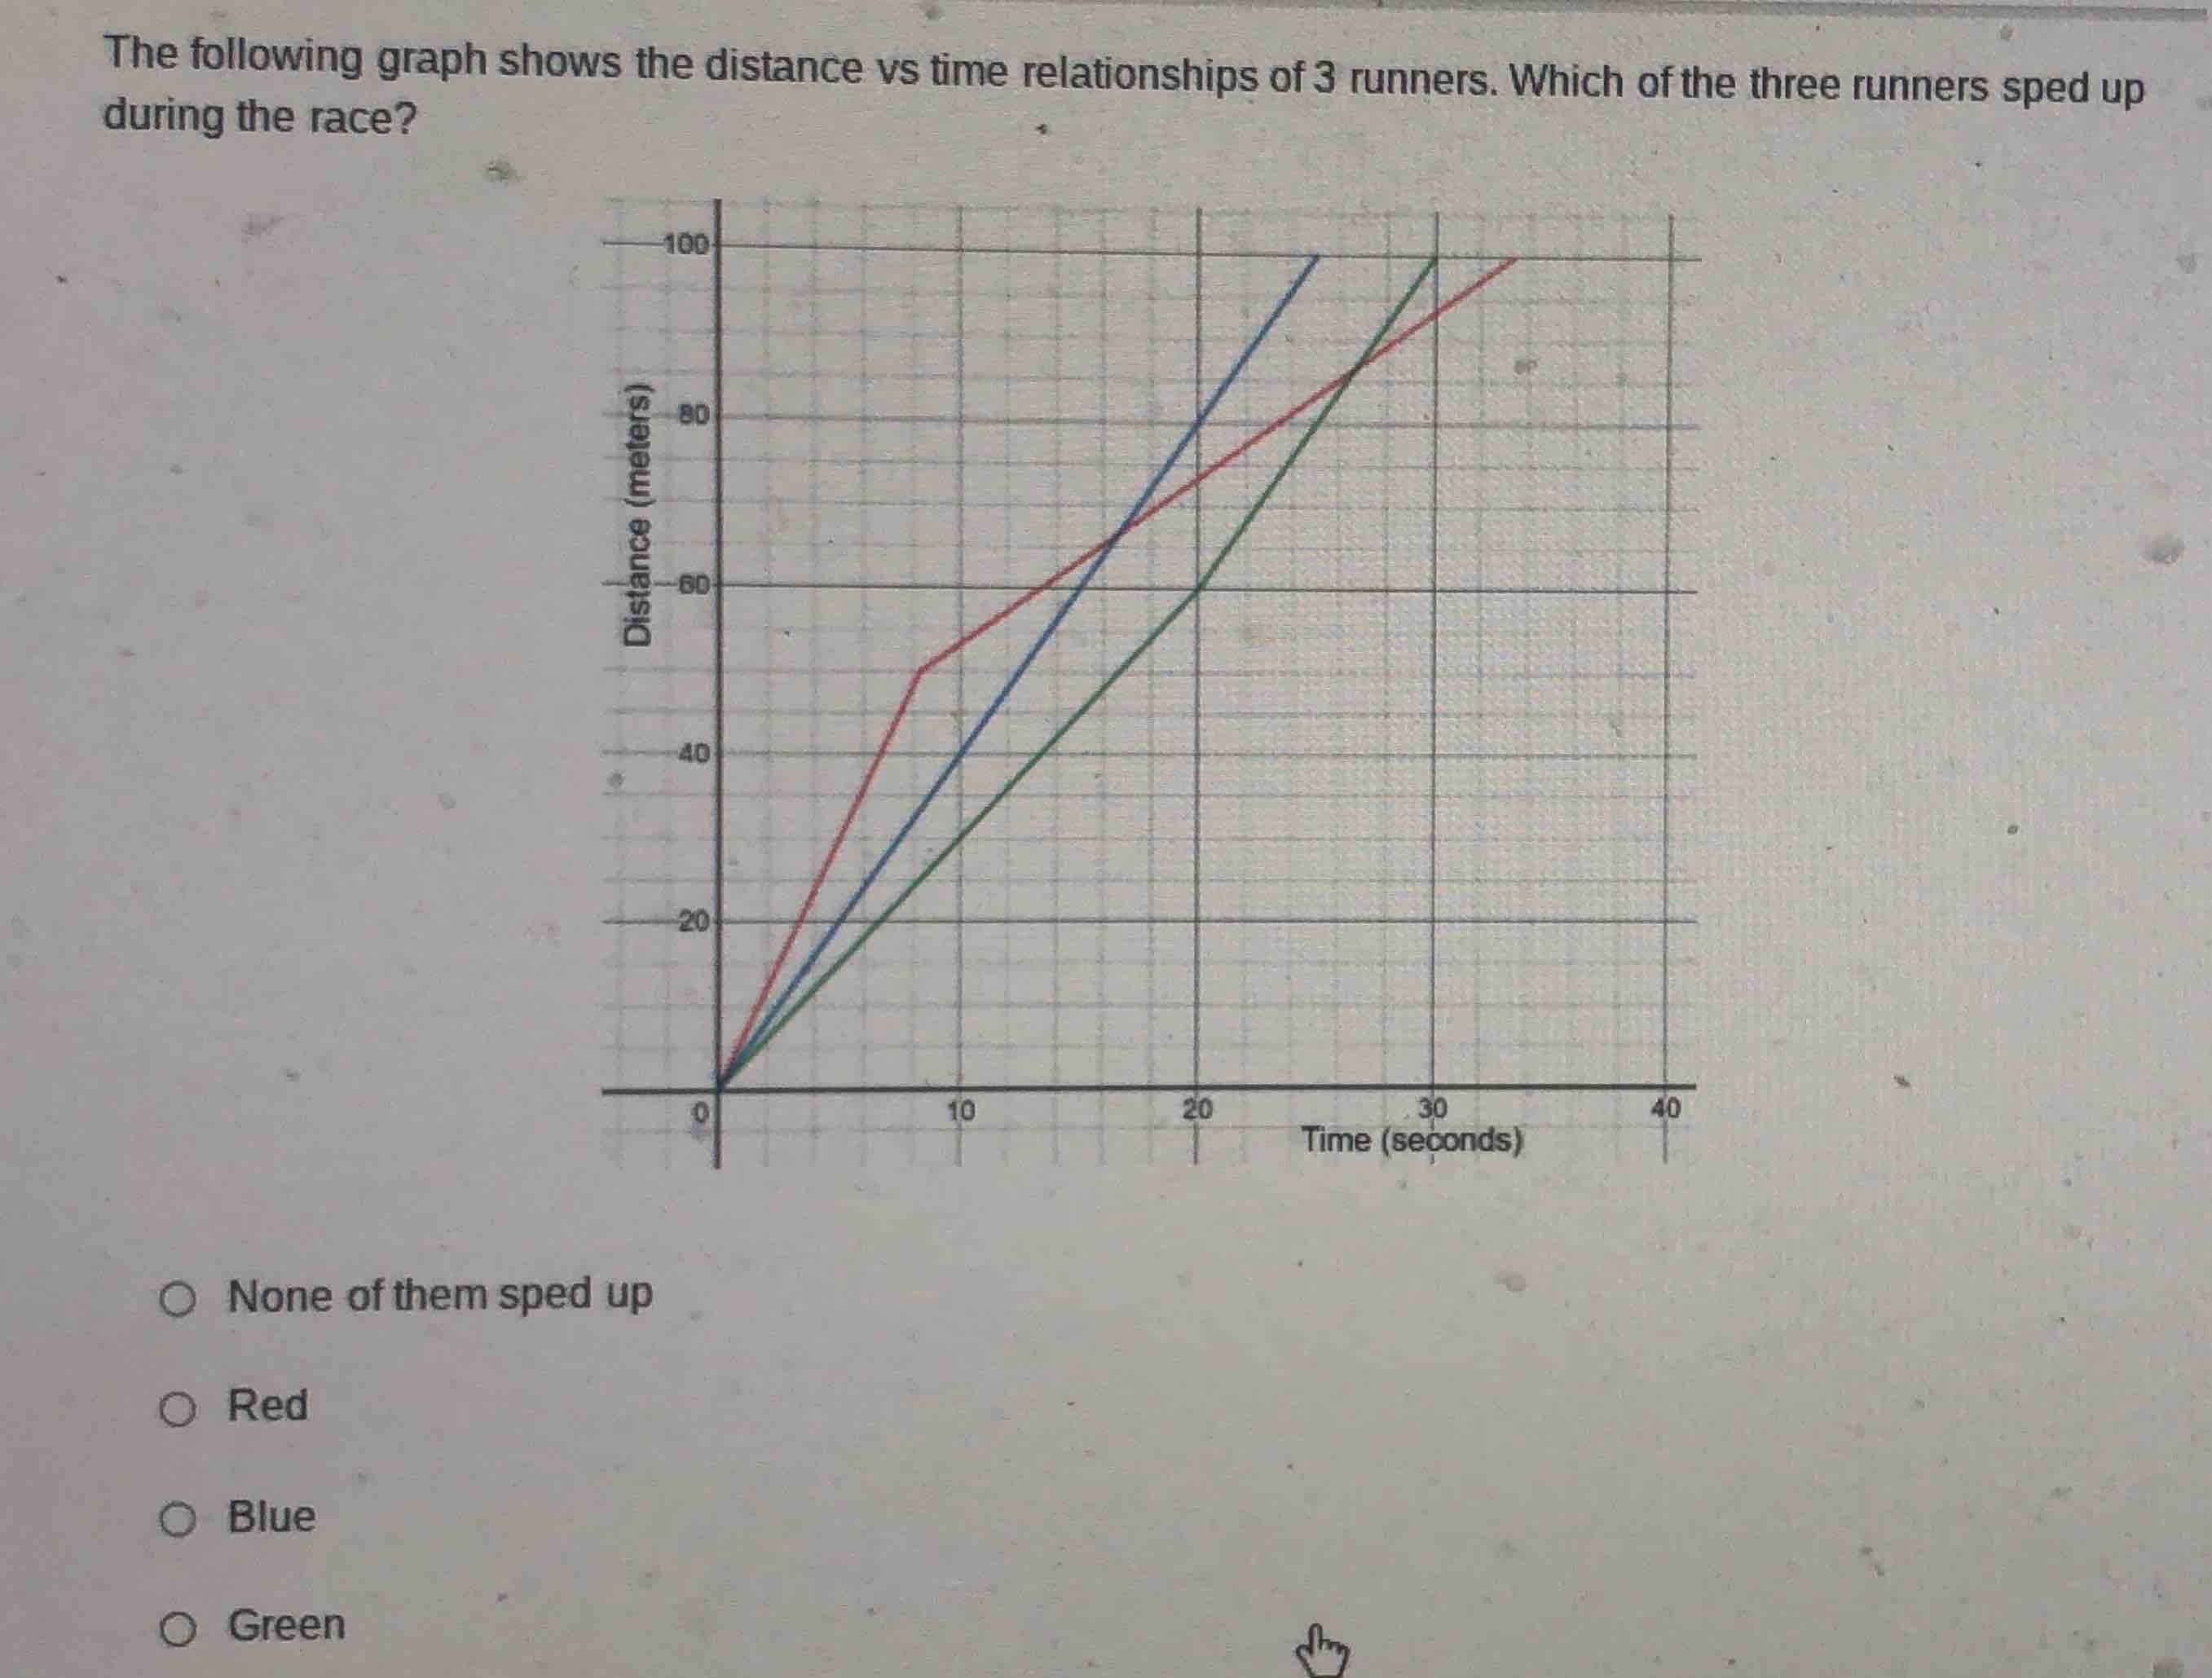
the following graph shows the distance vs time relationships of 3 runners. which of the three runners sped up during the race?
none of them sped up
red
blue
green
Understand the relationship between slope and speed
Using the Position-Time Graph Analysis and Instantaneous Velocity Interpretation knowledge points
$$
\text{Speed} = \text{Slope of the distance-time graph} = \frac{\Delta d}{\Delta t}
$$
An increase in speed (speeding up) corresponds to an increase in the slope (steepness) of the line over time.
Analyze the motion of each runner
Using the Position-Time Graph Analysis and Instantaneous Velocity Interpretation knowledge points
- Blue runner: The graph is a single straight line from \(t = 0\) to \(t = 25\text{ s}\). A constant slope means constant speed.
- Red runner: The graph has two segments. From \(t = 0\) to \(t = 8\text{ s}\), the slope is steep (\(v \approx 6.25\text{ m/s}\)). From \(t = 8\text{ s}\) onward, the slope becomes flatter (\(v \approx 1.92\text{ m/s}\)). This represents slowing down.
- Green runner: The graph has two segments. From \(t = 0\) to \(t = 20\text{ s}\), the slope is relatively gentle (\(v = 3\text{ m/s}\)). From \(t = 20\text{ s}\) to \(t = 30\text{ s}\), the slope becomes noticeably steeper (\(v = 4\text{ m/s}\)). An increase in slope means this runner sped up.
Identify the correct option
The green runner is the only one whose graph becomes steeper, indicating they sped up during the race.

Snap & solve any problem in the app
Get step-by-step solutions on Sovi AI
Photo-based solutions with guided steps
Explore more problems and detailed explanations
- None of them sped up
- (B) Red
- (C) Blue
- Green (Correct answer)