QUESTION IMAGE
Question
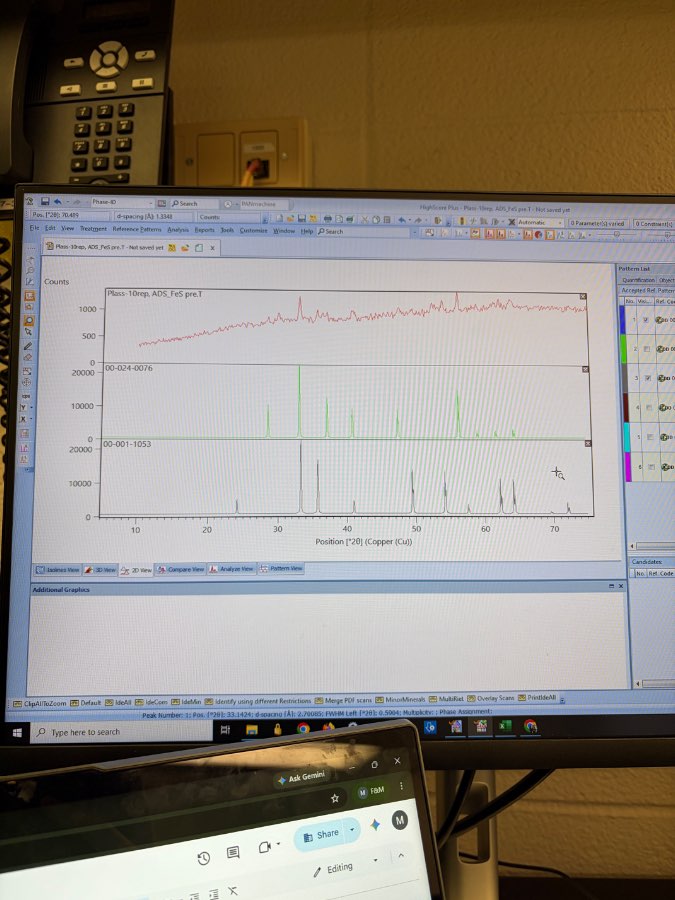
plass-10rep, ads_fes pre.t
00-024-0076
00-001-1053
position °2θ (copper (cu))
🆕 New Concept Discovered: XRD Phase Identification
Matching experimental diffraction peaks to reference patterns.
Step 1: Analyze the Experimental Pattern
The top red curve represents the experimental X-ray diffraction (XRD) pattern labeled "Plass-10rep, ADS_FeS pre.T".
- This pattern shows a high background with relatively broad, low-intensity peaks, indicating a material with low crystallinity or small crystallite size (often characteristic of amorphous or poorly crystalline iron sulfide phases).
- Key experimental peaks are visible at approximately:
- \( 2\theta \approx 33^\circ \) (a distinct, sharp peak)
- \( 2\theta \approx 43^\circ \) (a broad, weak feature)
- \( 2\theta \approx 53^\circ - 56^\circ \) (a broad peak region)
---
Step 2: Compare with Reference Pattern 1 (00-024-0076)
The middle green curve represents the reference pattern 00-024-0076 (typically corresponding to Troilite or Pyrrhotite-type iron sulfide, \( \text{Fe}_{1-x}\text{S} \) or \( \text{FeS} \)).
- It features prominent, sharp diffraction peaks at:
- \( 2\theta \approx 30^\circ \)
- \( 2\theta \approx 33.2^\circ \)
- \( 2\theta \approx 37^\circ \)
- \( 2\theta \approx 43.5^\circ \)
- \( 2\theta \approx 53^\circ \)
- \( 2\theta \approx 56^\circ \)
- Comparing this to the experimental red pattern:
- The sharp experimental peak at \( 2\theta \approx 33^\circ \) matches the strongest reference peak of this phase at \( 33.2^\circ \).
- The broad features around \( 43^\circ \) and \( 53^\circ - 56^\circ \) in the experimental data align well with the positions of the major peak clusters in this reference pattern.
---
Step 3: Compare with Reference Pattern 2 (00-001-1053)
The bottom grey curve represents the reference pattern 00-001-1053 (typically corresponding to Halite/NaCl or another cubic phase used as an internal standard or representing a different phase).
- It features prominent peaks at:
- \( 2\theta \approx 27.3^\circ \)
- \( 2\theta \approx 31.6^\circ \)
- \( 2\theta \approx 45.4^\circ \)
- \( 2\theta \approx 56.4^\circ \)
- \( 2\theta \approx 66.2^\circ \)
- Comparing this to the experimental red pattern:
- The experimental pattern does not show the characteristic strong peak at \( 2\theta \approx 31.6^\circ \) or \( 45.4^\circ \).
- Therefore, this phase is either absent or below the detection limit in the experimental sample.
---

Snap & solve any problem in the app
Get step-by-step solutions on Sovi AI
Photo-based solutions with guided steps
Explore more problems and detailed explanations
The experimental sample "Plass-10rep, ADS_FeS pre.T" is a match for the reference pattern 00-024-0076 (Iron Sulfide, \( \text{FeS} \)).
The primary matching peak is located at \( 2\theta \approx 33.14^\circ \) (as indicated in the status bar at the bottom: Pos. [°2θ]: 33.1424), which aligns perfectly with the main peak of the green reference pattern. The other reference pattern (00-001-1053) does not show a good match with the experimental peak positions.