QUESTION IMAGE
Question
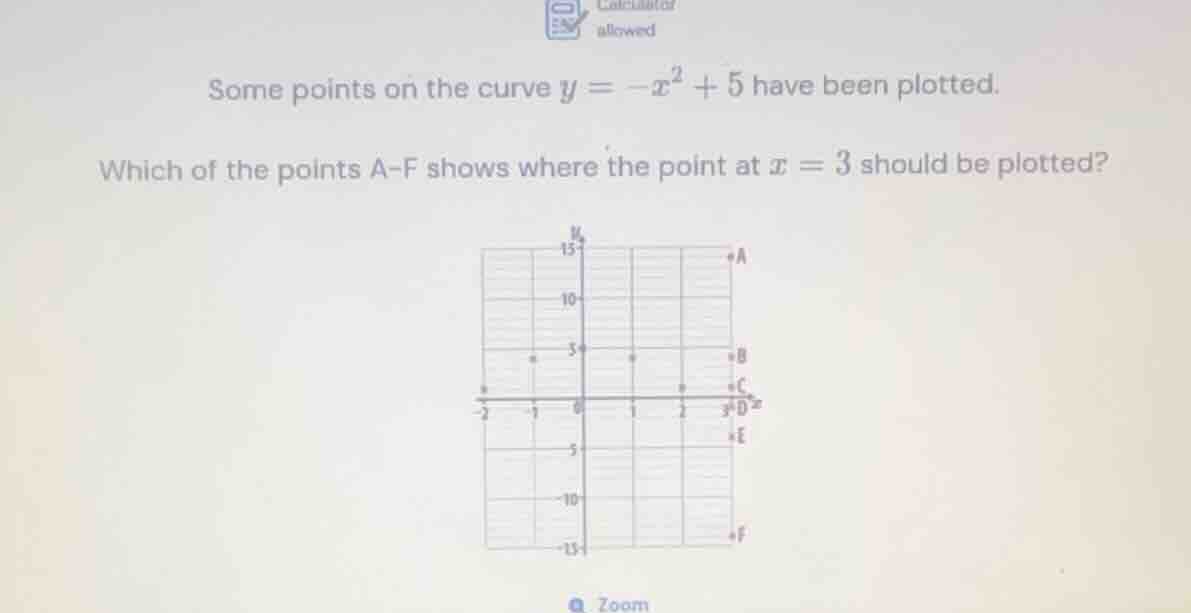
some points on the curve \\(y = -x^2 + 5\\) have been plotted.
which of the points a-f shows where the point at \\(x = 3\\) should be plotted?
<pre_analysis>
{
"quality": "clear",
"question_count": 1,
"skills_matched": [
"step_cot",
"multiple_choice_formatter",
"explain_then_answer",
"quick"
],
"needs_drawing": true,
"concepts_used": [
"Quadratic Evaluation",
"Table of Values"
],
"new_concepts": [
"Graphing Quadratic Functions"
],
"current_concepts": [
"Quadratic Evaluation",
"Table of Values",
"Graphing Quadratic Functions"
]
}
</pre_analysis>
<reasoning>
Evaluate the quadratic equation at \(x = 3\)
\[
y = -x^2 + 5
\]
\[
y = -(3)^2 + 5 = -9 + 5 = -4
\]
Identify the corresponding point on the graph
The coordinates of the point are \((3, -4)\).
Match the coordinates with the plotted points
Looking at the vertical line \(x = 3\):
- Point A is at \((3, 14)\)
- Point B is at \((3, 4)\)
- Point C is at \((3, 1)\)
- Point D is at \((3, 0)\)
- Point E is at \((3, -4)\)
- Point F is at \((3, -14)\)
Therefore, point E represents the correct location.
</reasoning>
<answer>
<mcq-option>(A) A</mcq-option>
<mcq-option>(B) B</mcq-option>
<mcq-option>(C) C</mcq-option>
<mcq-option>(D) D</mcq-option>
<mcq-correct>(E) E</mcq-correct>
<mcq-option>(F) F</mcq-option>
</answer>
<plot>
{
"elements": [
{
"type": "functiongraph",
"params": [
{
"js": "-x*x + 5",
"latex": "y = -x^2 + 5"
},
-4,
4
],
"properties": {
"strokeColor": "#8C55F2",
"strokeWidth": 2,
"name": "y = -x^2 + 5",
"withLabel": true
}
},
{
"type": "point",
"params": [
[3, -4]
],
"properties": {
"name": "E (3, -4)",
"size": 4,
"color": "#F2557F",
"strokeColor": "#F2557F",
"fillColor": "#F2557F",
"withLabel": true
}
},
{
"type": "point",
"params": [
[0, 5]
],
"properties": {
"name": "(0, 5)",
"size": 3,
"color": "#5583F2",
"strokeColor": "#5583F2",
"fillColor": "#5583F2",
"withLabel": true
}
},
{
"type": "point",
"params": [
[1, 4]
],
"properties": {
"name": "(1, 4)",
"size": 3,
"color": "#5583F2",
"strokeColor": "#5583F2",
"fillColor": "#5583F2",
"withLabel": true
}
},
{
"type": "point",
"params": [
[2, 1]
],
"properties": {
"name": "(2, 1)",
"size": 3,
"color": "#5583F2",
"strokeColor": "#5583F2",
"fillColor": "#5583F2",
"withLabel": true
}
}
]
}
</plot>
<post_analysis>
{
"subject": "Mathematics",
"question_type": "Multiple Choice",
"knowledge_point": [
"Mathematics",
"Algebra",
"Graphing Quadratic Functions"
]
}
</post_analysis>

Snap & solve any problem in the app
Get step-by-step solutions on Sovi AI
Photo-based solutions with guided steps
Explore more problems and detailed explanations
<pre_analysis>
{
"quality": "clear",
"question_count": 1,
"skills_matched": [
"step_cot",
"multiple_choice_formatter",
"explain_then_answer",
"quick"
],
"needs_drawing": true,
"concepts_used": [
"Quadratic Evaluation",
"Table of Values"
],
"new_concepts": [
"Graphing Quadratic Functions"
],
"current_concepts": [
"Quadratic Evaluation",
"Table of Values",
"Graphing Quadratic Functions"
]
}
</pre_analysis>
<reasoning>
Evaluate the quadratic equation at \(x = 3\)
\[
y = -x^2 + 5
\]
\[
y = -(3)^2 + 5 = -9 + 5 = -4
\]
Identify the corresponding point on the graph
The coordinates of the point are \((3, -4)\).
Match the coordinates with the plotted points
Looking at the vertical line \(x = 3\):
- Point A is at \((3, 14)\)
- Point B is at \((3, 4)\)
- Point C is at \((3, 1)\)
- Point D is at \((3, 0)\)
- Point E is at \((3, -4)\)
- Point F is at \((3, -14)\)
Therefore, point E represents the correct location.
</reasoning>
<answer>
<mcq-option>(A) A</mcq-option>
<mcq-option>(B) B</mcq-option>
<mcq-option>(C) C</mcq-option>
<mcq-option>(D) D</mcq-option>
<mcq-correct>(E) E</mcq-correct>
<mcq-option>(F) F</mcq-option>
</answer>
<plot>
{
"elements": [
{
"type": "functiongraph",
"params": [
{
"js": "-x*x + 5",
"latex": "y = -x^2 + 5"
},
-4,
4
],
"properties": {
"strokeColor": "#8C55F2",
"strokeWidth": 2,
"name": "y = -x^2 + 5",
"withLabel": true
}
},
{
"type": "point",
"params": [
[3, -4]
],
"properties": {
"name": "E (3, -4)",
"size": 4,
"color": "#F2557F",
"strokeColor": "#F2557F",
"fillColor": "#F2557F",
"withLabel": true
}
},
{
"type": "point",
"params": [
[0, 5]
],
"properties": {
"name": "(0, 5)",
"size": 3,
"color": "#5583F2",
"strokeColor": "#5583F2",
"fillColor": "#5583F2",
"withLabel": true
}
},
{
"type": "point",
"params": [
[1, 4]
],
"properties": {
"name": "(1, 4)",
"size": 3,
"color": "#5583F2",
"strokeColor": "#5583F2",
"fillColor": "#5583F2",
"withLabel": true
}
},
{
"type": "point",
"params": [
[2, 1]
],
"properties": {
"name": "(2, 1)",
"size": 3,
"color": "#5583F2",
"strokeColor": "#5583F2",
"fillColor": "#5583F2",
"withLabel": true
}
}
]
}
</plot>
<post_analysis>
{
"subject": "Mathematics",
"question_type": "Multiple Choice",
"knowledge_point": [
"Mathematics",
"Algebra",
"Graphing Quadratic Functions"
]
}
</post_analysis>