QUESTION IMAGE
Question
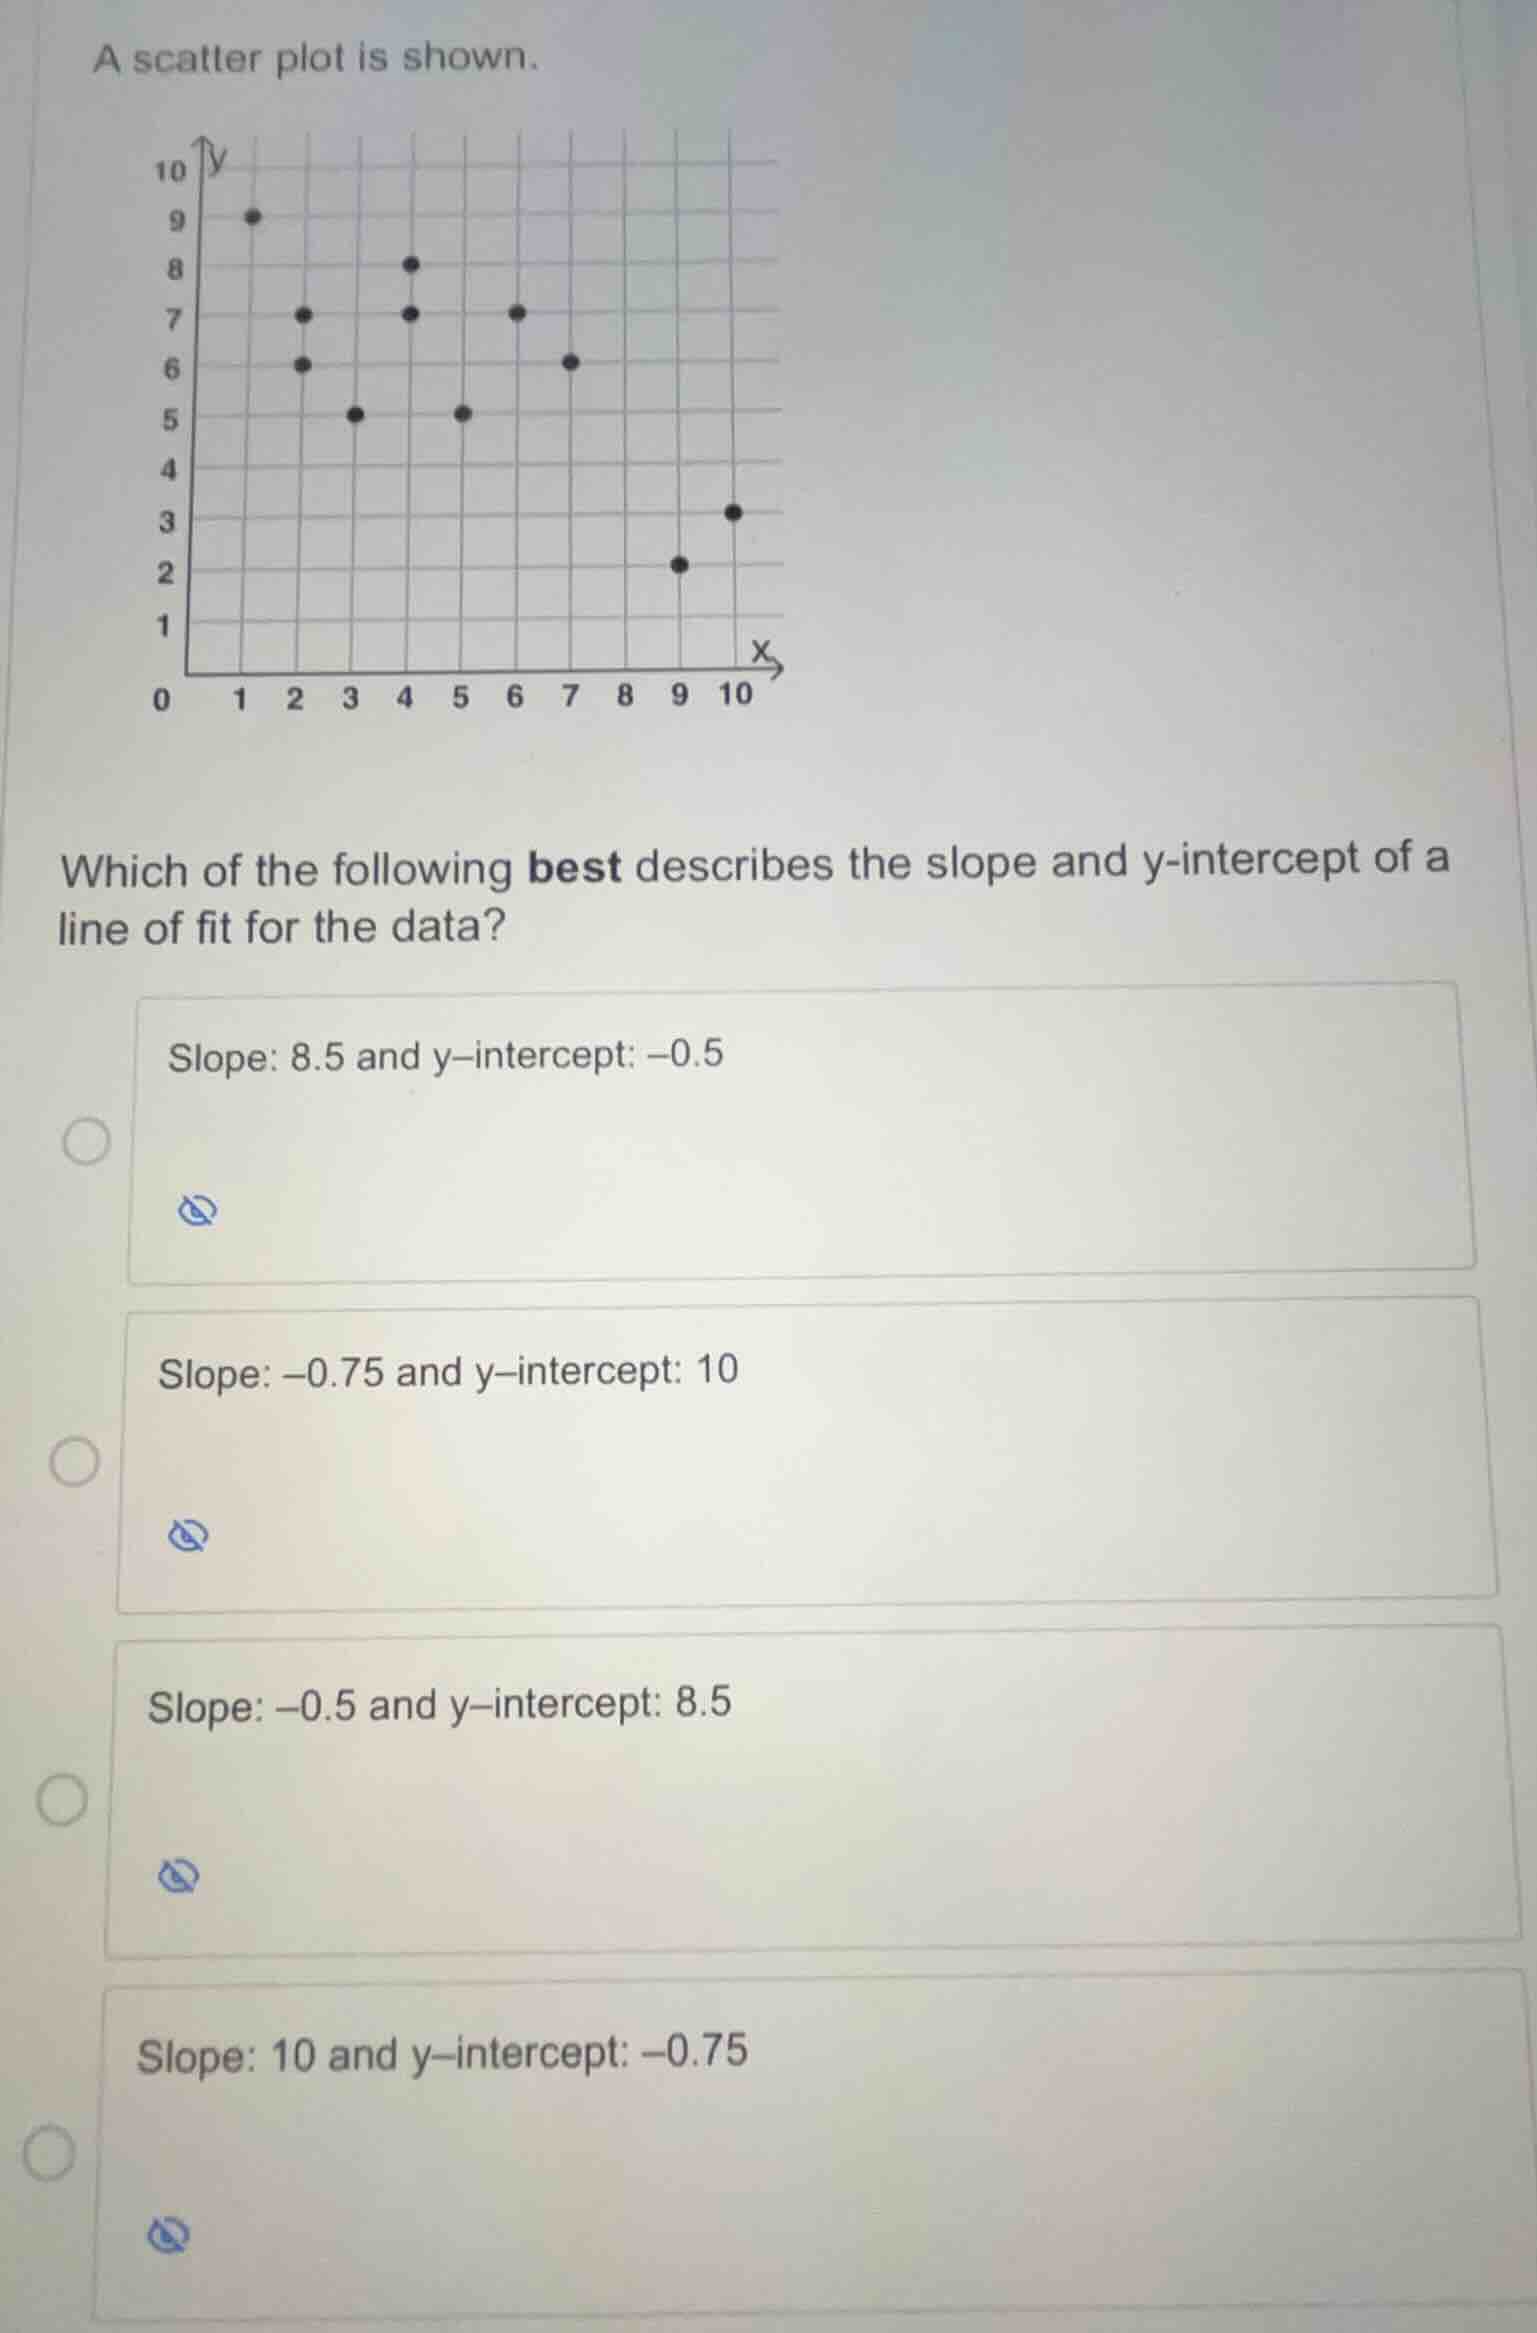
a scatter plot is shown.
which of the following best describes the slope and y-intercept of a line of fit for the data?
slope: 8.5 and y-intercept: -0.5
slope: -0.75 and y-intercept: 10
slope: -0.5 and y-intercept: 8.5
slope: 10 and y-intercept: -0.75
<pre_analysis>
{
"quality": "clear",
"question_count": 1,
"skills_matched": [
"step_cot",
"multiple_choice_formatter",
"explain_then_answer",
"tutor"
],
"needs_drawing": false,
"concepts_used": [
"Scatter Plots"
],
"new_concepts": [
"Line of Best Fit"
],
"current_concepts": [
"Scatter Plots",
"Line of Best Fit"
]
}
</pre_analysis>
<reasoning>
Analyze the overall trend of the data
Using the Scatter Plots knowledge point, we observe that as the \(x\)-values increase from \(1\) to \(10\), the \(y\)-values generally decrease from around \(9\) to around \(3\). This downward trend indicates a negative association, meaning the slope of any reasonable line of fit must be negative.
Evaluate the slope options
Since the trend is downward, the slope must be negative. This eliminates the options with positive slopes:
- Slope: \(8.5\) (positive)
- Slope: \(10\) (positive)
We are left with two options containing negative slopes:
- Slope: \(-0.75\) and \(y\)-intercept: \(10\)
- Slope: \(-0.5\) and \(y\)-intercept: \(8.5\)
Estimate the y-intercept
A line of fit should pass through the middle of the data points. Let's test both remaining linear models:
- For \(y = -0.75x + 10\):
- At \(x = 1\), \(y = 9.25\) (actual data point is at \((1, 9)\))
- At \(x = 4\), \(y = 7\) (actual data points are at \((4, 7)\) and \((4, 8)\))
- At \(x = 10\), \(y = 2.5\) (actual data point is at \((10, 3)\))
- For \(y = -0.5x + 8.5\):
- At \(x = 1\), \(y = 8\) (underestimates the point at \((1, 9)\))
- At \(x = 10\), \(y = 3.5\) (overestimates the points at the end, which are at \((9, 2)\) and \((10, 3)\))
Comparing the two, the line \(y = -0.75x + 10\) provides a much better balance and closer fit to the overall distribution of the points.
</reasoning>
<answer>
<mcq-option>Slope: 8.5 and y–intercept: –0.5</mcq-option>
<mcq-correct>Slope: –0.75 and y–intercept: 10</mcq-correct>
<mcq-option>Slope: –0.5 and y–intercept: 8.5</mcq-option>
<mcq-option>Slope: 10 and y–intercept: –0.75</mcq-option>
</answer>
<post_analysis>
{
"subject": "Mathematics",
"question_type": "Multiple Choice",
"knowledge_point": [
"Mathematics",
"Statistics",
"Line of Best Fit"
]
}
</post_analysis>

Snap & solve any problem in the app
Get step-by-step solutions on Sovi AI
Photo-based solutions with guided steps
Explore more problems and detailed explanations
<pre_analysis>
{
"quality": "clear",
"question_count": 1,
"skills_matched": [
"step_cot",
"multiple_choice_formatter",
"explain_then_answer",
"tutor"
],
"needs_drawing": false,
"concepts_used": [
"Scatter Plots"
],
"new_concepts": [
"Line of Best Fit"
],
"current_concepts": [
"Scatter Plots",
"Line of Best Fit"
]
}
</pre_analysis>
<reasoning>
Analyze the overall trend of the data
Using the Scatter Plots knowledge point, we observe that as the \(x\)-values increase from \(1\) to \(10\), the \(y\)-values generally decrease from around \(9\) to around \(3\). This downward trend indicates a negative association, meaning the slope of any reasonable line of fit must be negative.
Evaluate the slope options
Since the trend is downward, the slope must be negative. This eliminates the options with positive slopes:
- Slope: \(8.5\) (positive)
- Slope: \(10\) (positive)
We are left with two options containing negative slopes:
- Slope: \(-0.75\) and \(y\)-intercept: \(10\)
- Slope: \(-0.5\) and \(y\)-intercept: \(8.5\)
Estimate the y-intercept
A line of fit should pass through the middle of the data points. Let's test both remaining linear models:
- For \(y = -0.75x + 10\):
- At \(x = 1\), \(y = 9.25\) (actual data point is at \((1, 9)\))
- At \(x = 4\), \(y = 7\) (actual data points are at \((4, 7)\) and \((4, 8)\))
- At \(x = 10\), \(y = 2.5\) (actual data point is at \((10, 3)\))
- For \(y = -0.5x + 8.5\):
- At \(x = 1\), \(y = 8\) (underestimates the point at \((1, 9)\))
- At \(x = 10\), \(y = 3.5\) (overestimates the points at the end, which are at \((9, 2)\) and \((10, 3)\))
Comparing the two, the line \(y = -0.75x + 10\) provides a much better balance and closer fit to the overall distribution of the points.
</reasoning>
<answer>
<mcq-option>Slope: 8.5 and y–intercept: –0.5</mcq-option>
<mcq-correct>Slope: –0.75 and y–intercept: 10</mcq-correct>
<mcq-option>Slope: –0.5 and y–intercept: 8.5</mcq-option>
<mcq-option>Slope: 10 and y–intercept: –0.75</mcq-option>
</answer>
<post_analysis>
{
"subject": "Mathematics",
"question_type": "Multiple Choice",
"knowledge_point": [
"Mathematics",
"Statistics",
"Line of Best Fit"
]
}
</post_analysis>