QUESTION IMAGE
Question
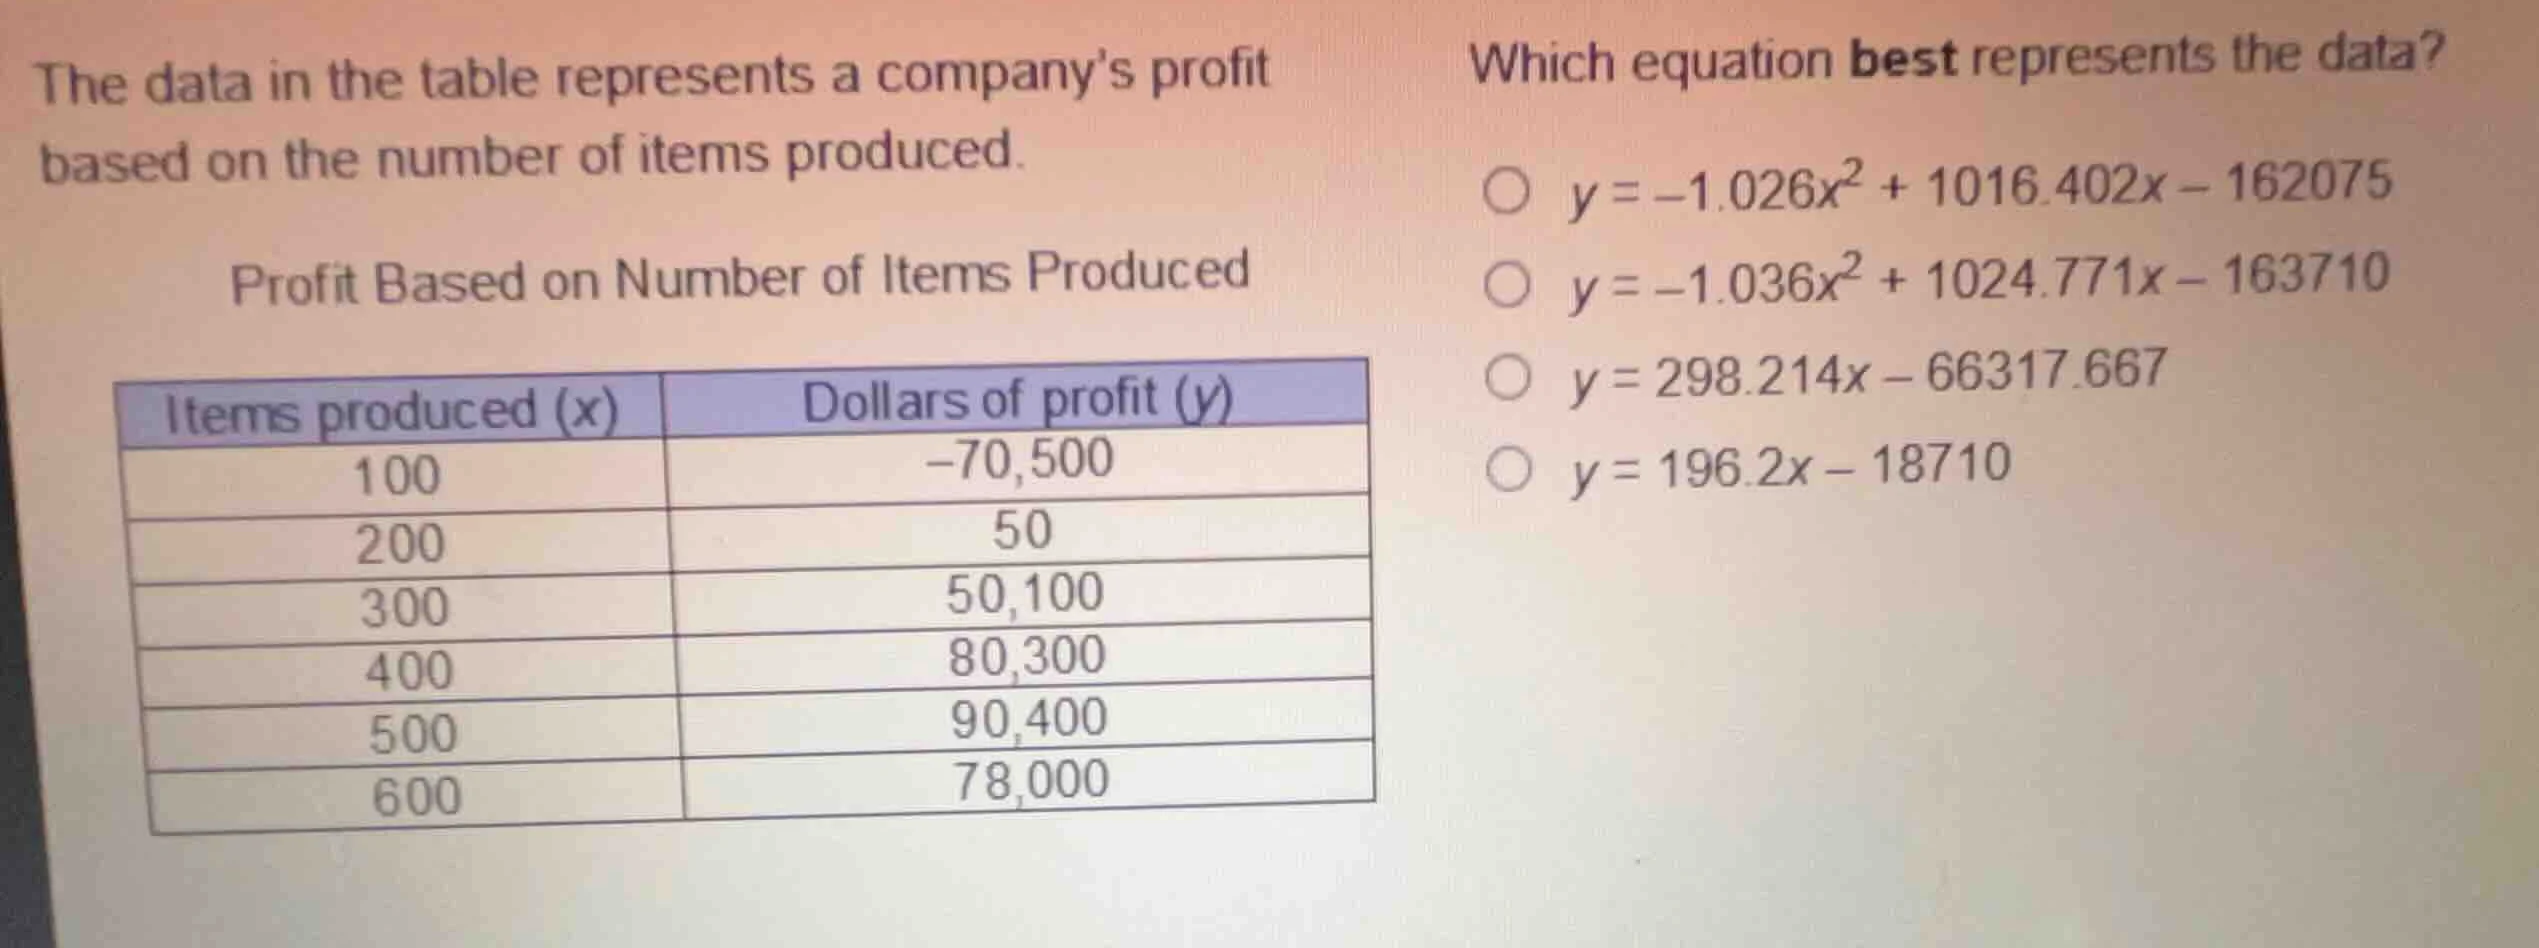
the data in the table represents a companys profit based on the number of items produced.
profit based on number of items produced
\
which equation best represents the data?
\\(y = -1.026x^2 + 1016.402x - 162075\\)
\\(y = -1.036x^2 + 1024.771x - 163710\\)
\\(y = 298.214x - 66317.667\\)
\\(y = 196.2x - 18710\\)
Analyze the trend of the data
The data points \((x, y)\) are:
- \((100, -70500)\)
- \((200, 50)\)
- \((300, 50100)\)
- \((400, 80300)\)
- \((500, 90400)\)
- \((600, 78000)\)
The profit \(y\) increases from \(x = 100\) to \(x = 500\) and then decreases at \(x = 600\). This indicates a downward-opening quadratic relationship, so the equation must be of the form \(y = ax^2 + bx + c\) with \(a < 0\).
Test the first quadratic equation
Substitute \(x = 300\) into \(y = -1.026x^2 + 1016.402x - 162075\):
This is extremely close to the table value of \(50100\).
Test the second quadratic equation
Substitute \(x = 300\) into \(y = -1.036x^2 + 1024.771x - 163710\):
Now substitute \(x = 100\) into both equations to compare:
For the first equation:
For the second equation:
The first equation provides a significantly closer fit to the data.

Snap & solve any problem in the app
Get step-by-step solutions on Sovi AI
Photo-based solutions with guided steps
Explore more problems and detailed explanations
- (A) \(y = -1.026x^2 + 1016.402x - 162075\) (Correct answer)
- (B) \(y = -1.036x^2 + 1024.771x - 163710\)
- (C) \(y = 298.214x - 66317.667\)
- (D) \(y = 196.2x - 18710\)