QUESTION IMAGE
Question
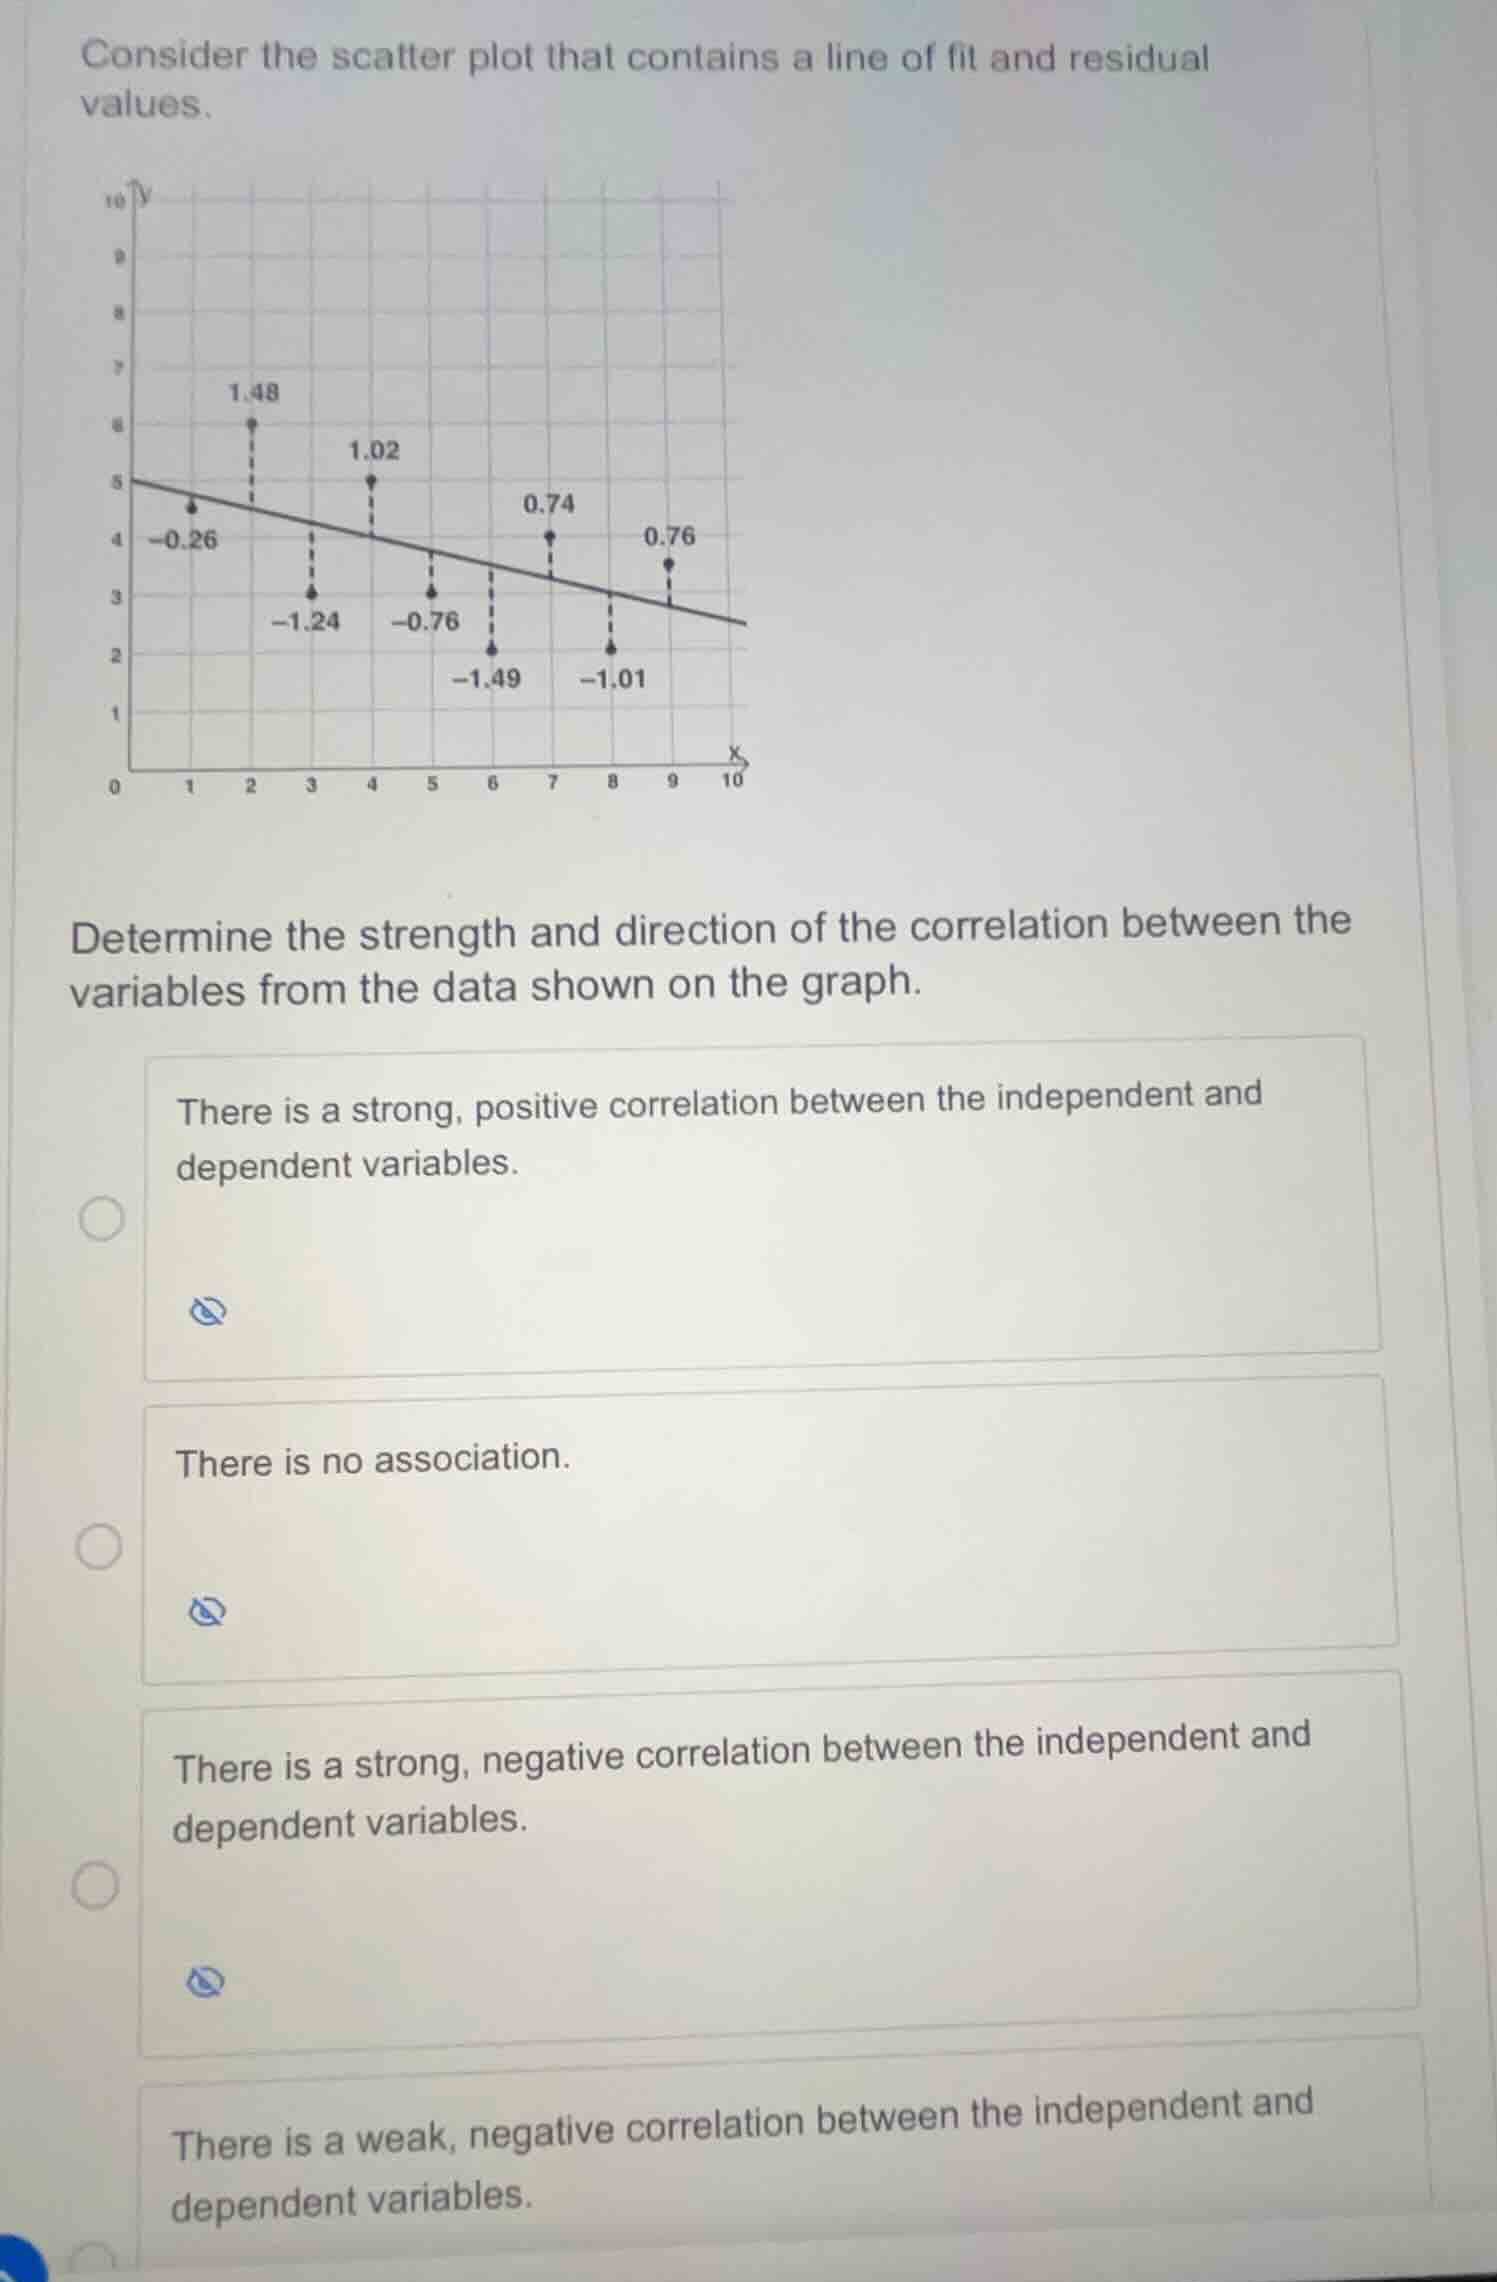
consider the scatter plot that contains a line of fit and residual values.
determine the strength and direction of the correlation between the variables from the data shown on the graph.
- there is a strong, positive correlation between the independent and dependent variables.
- there is no association.
- there is a strong, negative correlation between the independent and dependent variables.
- there is a weak, negative correlation between the independent and dependent variables.
<pre_analysis>
{
"quality": "clear",
"question_count": 1,
"skills_matched": [
"direct_cot",
"multiple_choice_formatter",
"explain_then_answer",
"tutor"
],
"needs_drawing": false,
"concepts_used": [
"Rate of Change",
"Linear Functions"
],
"new_concepts": [
"Residual Analysis",
"Correlation Strength",
"Scatter Plots"
],
"current_concepts": [
"Rate of Change",
"Linear Functions",
"Residual Analysis",
"Correlation Strength",
"Scatter Plots"
]
}
</pre_analysis>
<reasoning>
Analyze the direction of the correlation
The line of fit on the scatter plot slopes downward from left to right. This negative Rate of Change indicates that as the independent variable \(x\) increases, the dependent variable \(y\) decreases, showing a negative correlation.
Evaluate the residuals for correlation strength
The residuals represent the vertical distances between the actual data points and the line of fit. The given residual values are:
\[
-0.26, 1.48, -1.24, 1.02, -0.76, -1.49, 0.74, -1.01, 0.76
\]
These residuals are relatively large compared to the scale of the \(y\)-axis (where values range from 0 to 10). The points are widely scattered both above and below the line of fit.
Determine the overall correlation
Because the data points do not lie very close to the line of fit (indicated by the substantial residual values), the correlation is not strong. Combined with the downward slope of the Linear Functions model, we conclude there is a weak, negative correlation between the variables.
</reasoning>
<answer>
<mcq-option>There is a strong, positive correlation between the independent and dependent variables.</mcq-option>
<mcq-option>There is no association.</mcq-option>
<mcq-option>There is a strong, negative correlation between the independent and dependent variables.</mcq-option>
<mcq-correct>There is a weak, negative correlation between the independent and dependent variables.</mcq-correct>
</answer>
<post_analysis>
{
"subject": "Mathematics",
"question_type": "Multiple Choice",
"knowledge_point": [
"Mathematics",
"Statistics",
"Scatter Plots"
]
}
</post_analysis>

Snap & solve any problem in the app
Get step-by-step solutions on Sovi AI
Photo-based solutions with guided steps
Explore more problems and detailed explanations
<pre_analysis>
{
"quality": "clear",
"question_count": 1,
"skills_matched": [
"direct_cot",
"multiple_choice_formatter",
"explain_then_answer",
"tutor"
],
"needs_drawing": false,
"concepts_used": [
"Rate of Change",
"Linear Functions"
],
"new_concepts": [
"Residual Analysis",
"Correlation Strength",
"Scatter Plots"
],
"current_concepts": [
"Rate of Change",
"Linear Functions",
"Residual Analysis",
"Correlation Strength",
"Scatter Plots"
]
}
</pre_analysis>
<reasoning>
Analyze the direction of the correlation
The line of fit on the scatter plot slopes downward from left to right. This negative Rate of Change indicates that as the independent variable \(x\) increases, the dependent variable \(y\) decreases, showing a negative correlation.
Evaluate the residuals for correlation strength
The residuals represent the vertical distances between the actual data points and the line of fit. The given residual values are:
\[
-0.26, 1.48, -1.24, 1.02, -0.76, -1.49, 0.74, -1.01, 0.76
\]
These residuals are relatively large compared to the scale of the \(y\)-axis (where values range from 0 to 10). The points are widely scattered both above and below the line of fit.
Determine the overall correlation
Because the data points do not lie very close to the line of fit (indicated by the substantial residual values), the correlation is not strong. Combined with the downward slope of the Linear Functions model, we conclude there is a weak, negative correlation between the variables.
</reasoning>
<answer>
<mcq-option>There is a strong, positive correlation between the independent and dependent variables.</mcq-option>
<mcq-option>There is no association.</mcq-option>
<mcq-option>There is a strong, negative correlation between the independent and dependent variables.</mcq-option>
<mcq-correct>There is a weak, negative correlation between the independent and dependent variables.</mcq-correct>
</answer>
<post_analysis>
{
"subject": "Mathematics",
"question_type": "Multiple Choice",
"knowledge_point": [
"Mathematics",
"Statistics",
"Scatter Plots"
]
}
</post_analysis>