QUESTION IMAGE
Question
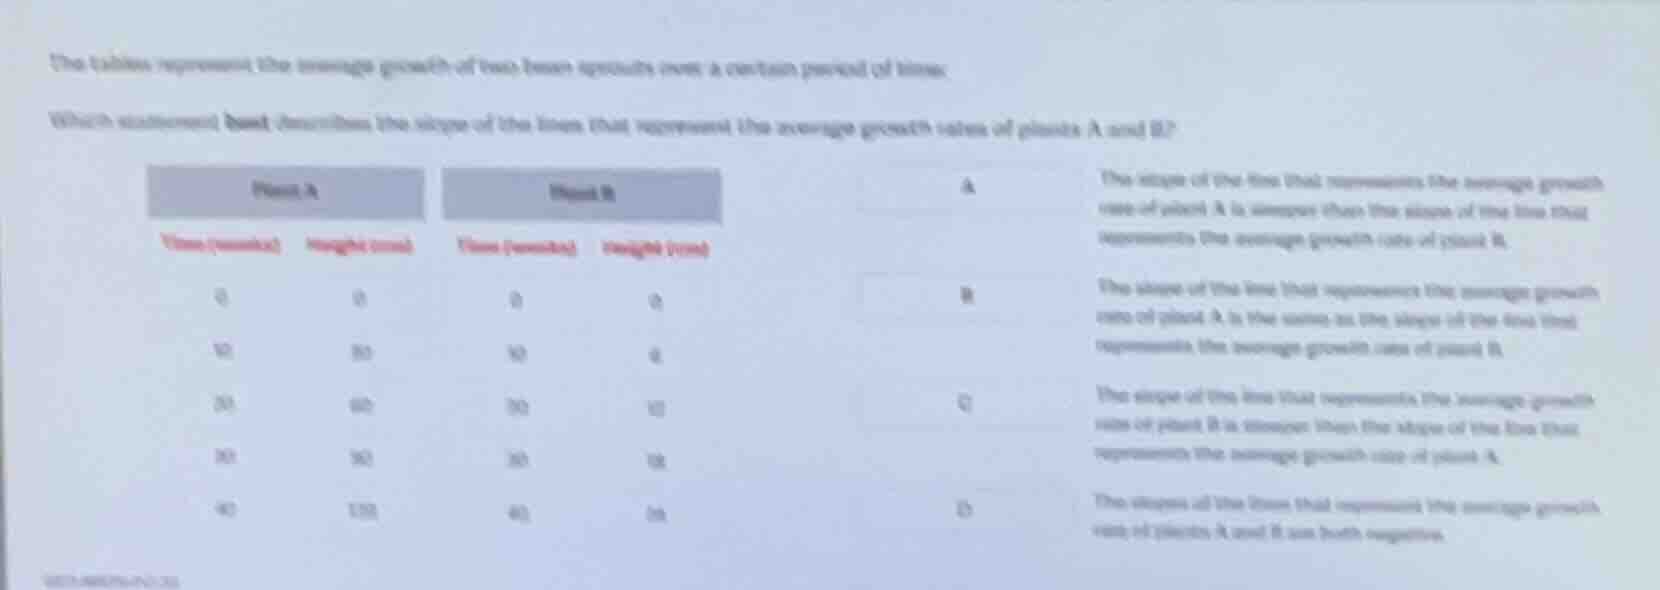
the tables represent the average growth of two bean sprouts over a certain period of time.
which statement best describes the slope of the lines that represent the average growth rates of plants a and b?
plant a
time (weeks) | height (cm)
0 | 0
10 | 30
20 | 60
30 | 90
40 | 120
plant b
time (weeks) | height (cm)
0 | 0
10 | 6
20 | 12
30 | 18
40 | 24
a. the slope of the line that represents the average growth rate of plant a is steeper than the slope of the line that represents the average growth rate of plant b.
b. the slope of the line that represents the average growth rate of plant a is the same as the slope of the line that represents the average growth rate of plant b.
c. the slope of the line that represents the average growth rate of plant b is steeper than the slope of the line that represents the average growth rate of plant a.
d. the slopes of the lines that represent the average growth rate of plants a and b are both negative.
🆕 New Concept Discovered: Slope of a Line from a Table
How fast a value changes over time.
Step 1: Identify data for Plant A
From the table for Plant A:
- Time \( (x) \): \( 0, 10, 20, 30, 40 \)
- Height \( (y) \): \( 0, 30, 60, 90, 120 \)
Calculate the slope (growth rate) for Plant A using two points, \( (0, 0) \) and \( (10, 30) \):
\[ m_A = \frac{30 - 0}{10 - 0} = 3\text{ cm/week} \]
Step 2: Identify data for Plant B
From the table for Plant B:
- Time \( (x) \): \( 0, 10, 20, 30, 40 \)
- Height \( (y) \): \( 0, 6, 12, 18, 24 \)
Calculate the slope (growth rate) for Plant B using two points, \( (0, 0) \) and \( (10, 6) \):
\[ m_B = \frac{6 - 0}{10 - 0} = 0.6\text{ cm/week} \]
Step 3: Compare the slopes
- Slope of Plant A: \( 3 \)
- Slope of Plant B: \( 0.6 \)
Since \( 3 > 0.6 \), the slope of the line representing Plant A is steeper than the slope of the line representing Plant B. This corresponds to statement A.

Snap & solve any problem in the app
Get step-by-step solutions on Sovi AI
Photo-based solutions with guided steps
Explore more problems and detailed explanations
A (The slope of the line that represents the average growth rate of plant A is steeper than the slope of the line that represents the average growth rate of plant B.)