QUESTION IMAGE
Question
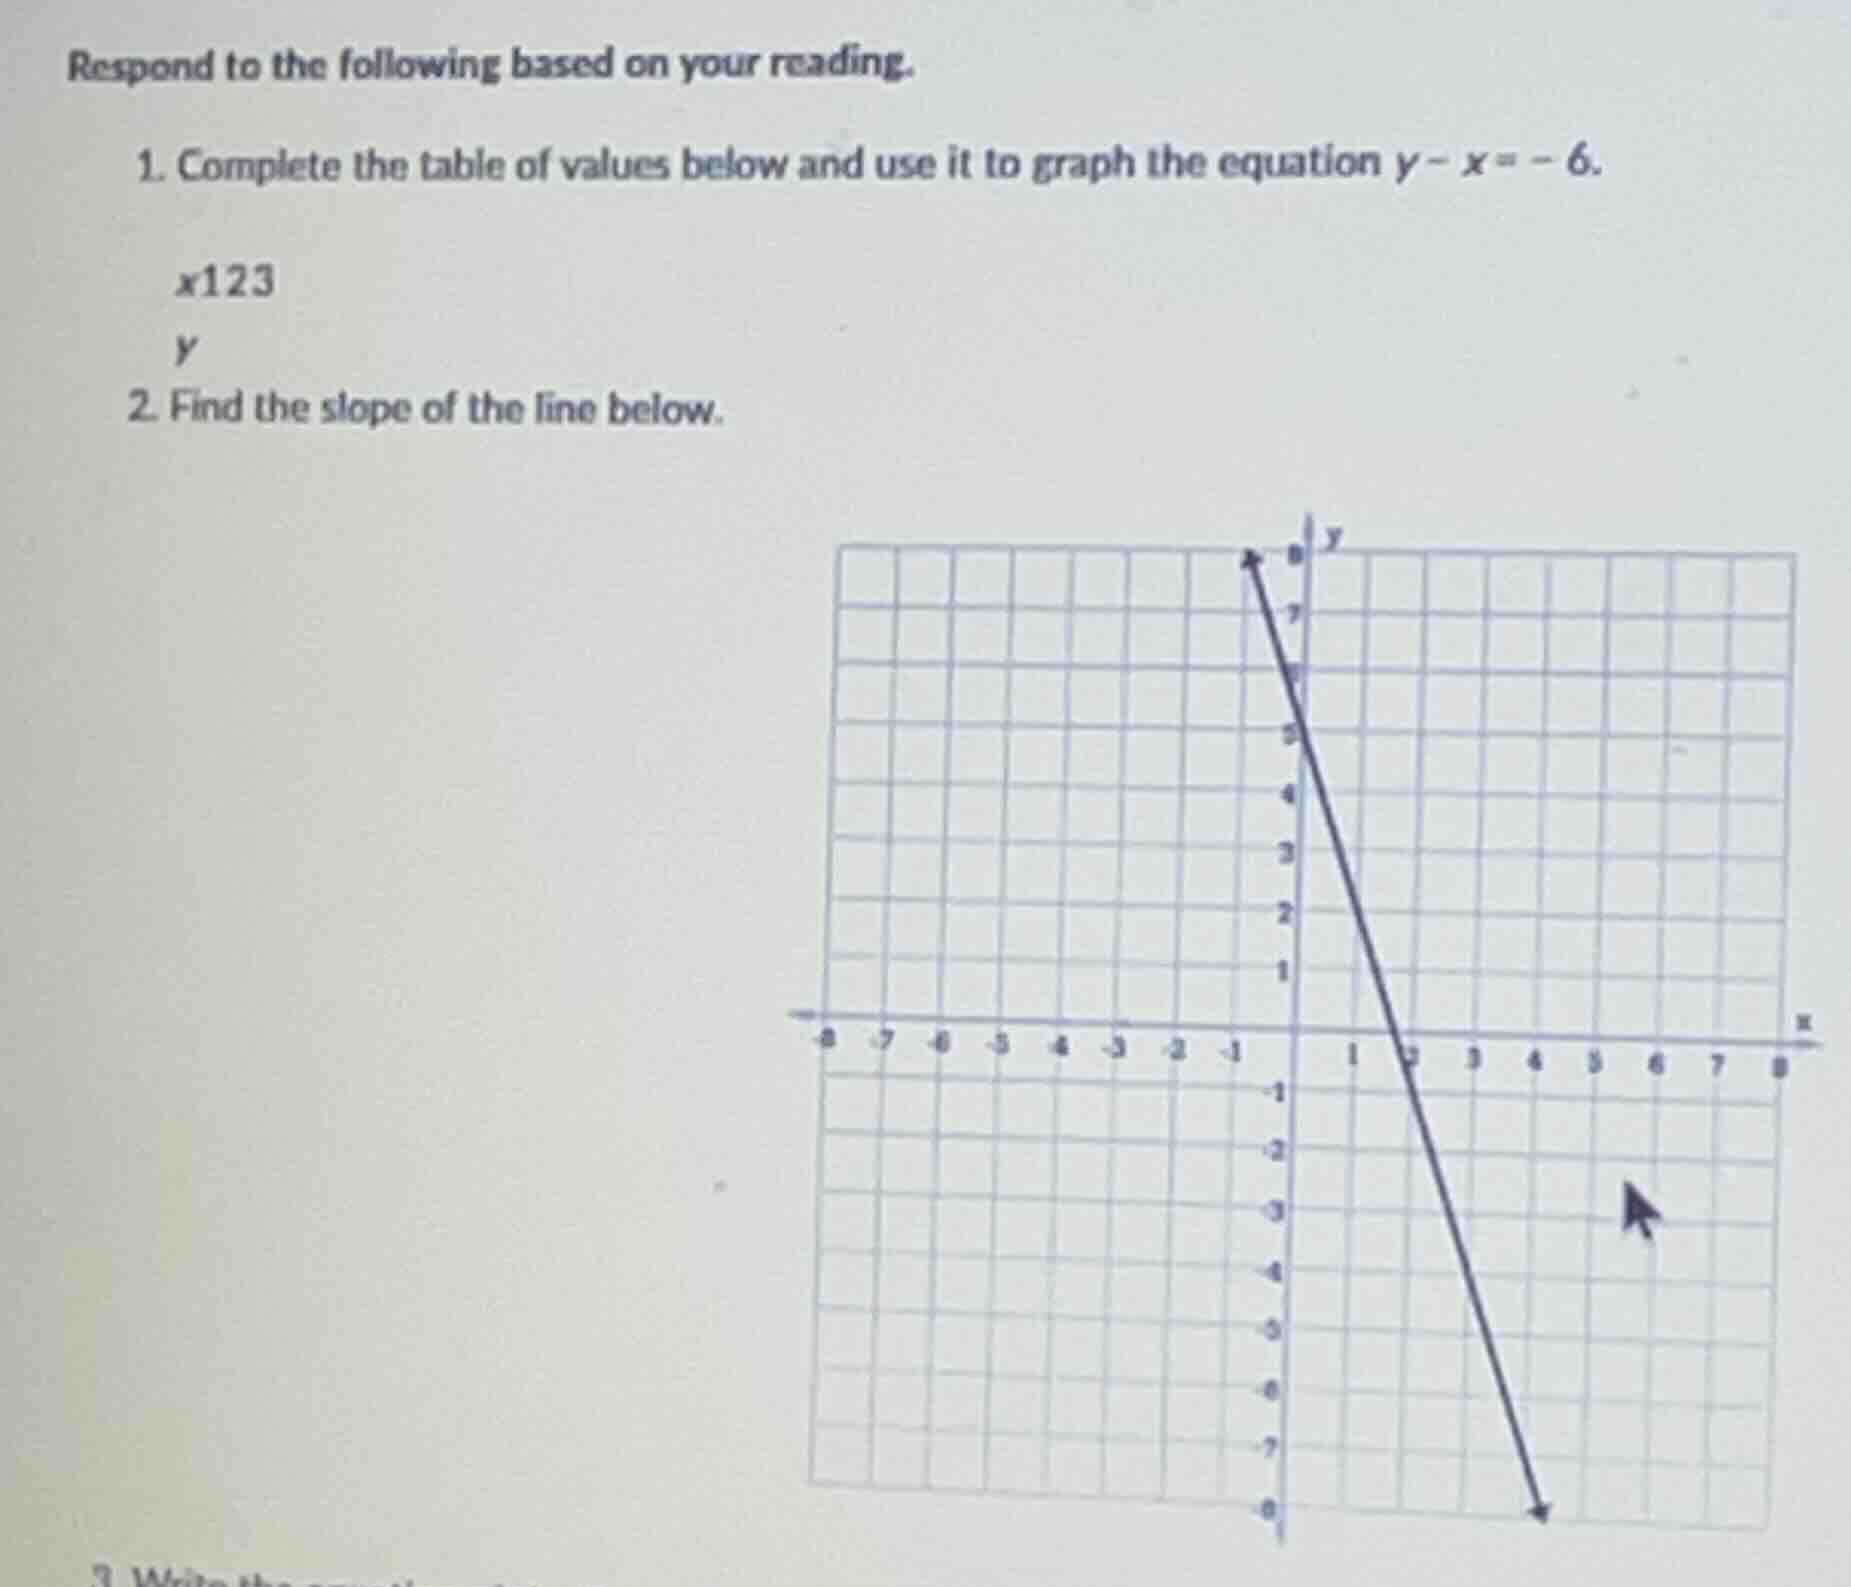
respond to the following based on your reading.
- complete the table of values below and use it to graph the equation \\(y - x = -6\\).
\\(\
\\)
- find the slope of the line below.
<pre_analysis>
{
"quality": "clear",
"question_count": 2,
"skills_matched": [
"step_cot",
"explain_then_answer",
"quick"
],
"needs_drawing": true,
"concepts_used": [
"Linear Modeling",
"Algebraic Expression Evaluation"
],
"new_concepts": [
"Slope of a Line",
"Graphing Linear Equations"
],
"current_concepts": [
"Linear Modeling",
"Algebraic Expression Evaluation",
"Slope of a Line",
"Graphing Linear Equations"
]
}
</pre_analysis>
<reasoning>
Solve for y-values in the table
Using the equation \(y - x = -6\), solve for \(y\) by rewriting it as \(y = x - 6\):
\[
\]
Find the slope of the line in Question 2
Identify two points on the given line from the graph: \((0, 5)\) and \((2, -1)\). Apply the slope formula \(m = \frac{y_2 - y_1}{x_2 - x_1}\):
\[
m = \frac{-1 - 5}{2 - 0} = \frac{-6}{2} = -3
\]
</reasoning>
<answer>
Question 1
| \(x\) | 1 | 2 | 3 |
|---|
Question 2
The slope of the line is \(-3\).
</answer>
<plot>
{
"elements": [
{
"type": "functiongraph",
"params": [
{
"js": "x - 6",
"latex": "x - 6"
},
-10,
10
],
"properties": {
"strokeColor": "#8C55F2",
"strokeWidth": 2,
"name": "y - x = -6",
"withLabel": true
}
},
{
"type": "point",
"params": [[1, -5]],
"properties": {
"name": "(1, -5)",
"color": "#5583F2",
"size": 3
}
},
{
"type": "point",
"params": [[2, -4]],
"properties": {
"name": "(2, -4)",
"color": "#5583F2",
"size": 3
}
},
{
"type": "point",
"params": [[3, -3]],
"properties": {
"name": "(3, -3)",
"color": "#5583F2",
"size": 3
}
},
{
"type": "functiongraph",
"params": [
{
"js": "-3*x + 5",
"latex": "-3x + 5"
},
-10,
10
],
"properties": {
"strokeColor": "#F2557F",
"strokeWidth": 2,
"name": "Line from Q2",
"withLabel": true
}
}
]
}
</plot>
<post_analysis>
{
"subject": "Mathematics",
"question_type": "Multi-part",
"knowledge_point": [
"Mathematics",
"Algebra",
"Linear Equations and Slope"
]
}
</post_analysis>

Snap & solve any problem in the app
Get step-by-step solutions on Sovi AI
Photo-based solutions with guided steps
Explore more problems and detailed explanations
<pre_analysis>
{
"quality": "clear",
"question_count": 2,
"skills_matched": [
"step_cot",
"explain_then_answer",
"quick"
],
"needs_drawing": true,
"concepts_used": [
"Linear Modeling",
"Algebraic Expression Evaluation"
],
"new_concepts": [
"Slope of a Line",
"Graphing Linear Equations"
],
"current_concepts": [
"Linear Modeling",
"Algebraic Expression Evaluation",
"Slope of a Line",
"Graphing Linear Equations"
]
}
</pre_analysis>
<reasoning>
Solve for y-values in the table
Using the equation \(y - x = -6\), solve for \(y\) by rewriting it as \(y = x - 6\):
\[
\]
Find the slope of the line in Question 2
Identify two points on the given line from the graph: \((0, 5)\) and \((2, -1)\). Apply the slope formula \(m = \frac{y_2 - y_1}{x_2 - x_1}\):
\[
m = \frac{-1 - 5}{2 - 0} = \frac{-6}{2} = -3
\]
</reasoning>
<answer>
Question 1
| \(x\) | 1 | 2 | 3 |
|---|
Question 2
The slope of the line is \(-3\).
</answer>
<plot>
{
"elements": [
{
"type": "functiongraph",
"params": [
{
"js": "x - 6",
"latex": "x - 6"
},
-10,
10
],
"properties": {
"strokeColor": "#8C55F2",
"strokeWidth": 2,
"name": "y - x = -6",
"withLabel": true
}
},
{
"type": "point",
"params": [[1, -5]],
"properties": {
"name": "(1, -5)",
"color": "#5583F2",
"size": 3
}
},
{
"type": "point",
"params": [[2, -4]],
"properties": {
"name": "(2, -4)",
"color": "#5583F2",
"size": 3
}
},
{
"type": "point",
"params": [[3, -3]],
"properties": {
"name": "(3, -3)",
"color": "#5583F2",
"size": 3
}
},
{
"type": "functiongraph",
"params": [
{
"js": "-3*x + 5",
"latex": "-3x + 5"
},
-10,
10
],
"properties": {
"strokeColor": "#F2557F",
"strokeWidth": 2,
"name": "Line from Q2",
"withLabel": true
}
}
]
}
</plot>
<post_analysis>
{
"subject": "Mathematics",
"question_type": "Multi-part",
"knowledge_point": [
"Mathematics",
"Algebra",
"Linear Equations and Slope"
]
}
</post_analysis>