QUESTION IMAGE
Question
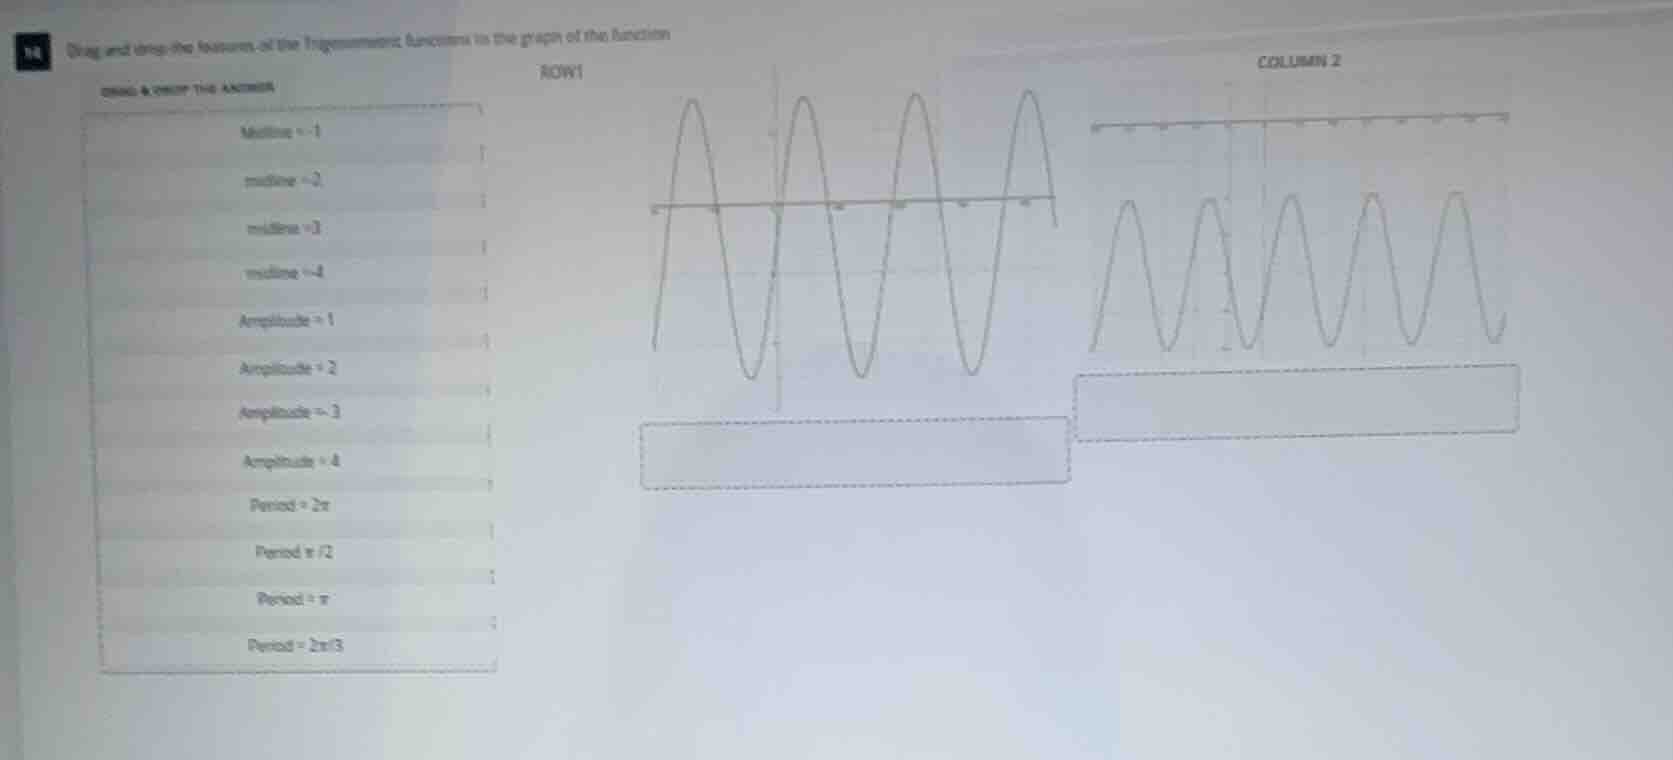
drag and drop the features of the trigonometric functions to the graph of the function
row 1
drag & drop the answer
midline = 1
midline = 2
midline = 3
midline = 4
amplitude = 1
amplitude = 2
amplitude = 3
amplitude = 4
period = 2\pi
period = \pi/2
period = \pi
period = 2\pi/3
column 2
⚡ Using what you learned: Graphing Trigonometric Functions
Step 1: Analyze the graph in ROW 1 (Left Graph)
- Midline: The horizontal line that runs halfway between the maximum and minimum values.
- Maximum value: \(y = 3\)
- Minimum value: \(y = -5\)
- Midline calculation:
\[
y = \frac{3 + (-5)}{2} = -1
\]
- Therefore, Midline = -1.
- Amplitude: The vertical distance between the midline and a peak (or trough).
- Amplitude calculation:
\[
\text{Amplitude} = 3 - (-1) = 4
\]
- Therefore, Amplitude = 4.
- Period: The horizontal distance required for the function to complete one full cycle.
- Looking at the x-axis, a full cycle starts at \(x = 0\) (on the midline, going up) and completes its next upward-going midline crossing at \(x = \pi\).
- Therefore, Period = \(\pi\).
---
Step 2: Analyze the graph in COLUMN 2 (Right Graph)
- Midline:
- Maximum value: \(y = -1\)
- Minimum value: \(y = -5\)
- Midline calculation:
\[
y = \frac{-1 + (-5)}{2} = -3
\]
- Therefore, Midline = -3.
- Amplitude:
- Amplitude calculation:
\[
\text{Amplitude} = -1 - (-3) = 2
\]
- Therefore, Amplitude = 2.
- Period:
- Looking at the x-axis, the distance between consecutive peaks is from \(x = 0\) to \(x = \frac{2\pi}{3}\).
- Therefore, Period = \(2\pi/3\).

Snap & solve any problem in the app
Get step-by-step solutions on Sovi AI
Photo-based solutions with guided steps
Explore more problems and detailed explanations
- ROW 1 (Left Graph Features):
- Midline = -1
- Amplitude = 4
- Period = \(\pi\)
- COLUMN 2 (Right Graph Features):
- Midline = -3
- Amplitude = 2
- Period = \(2\pi/3\)