QUESTION IMAGE
Question
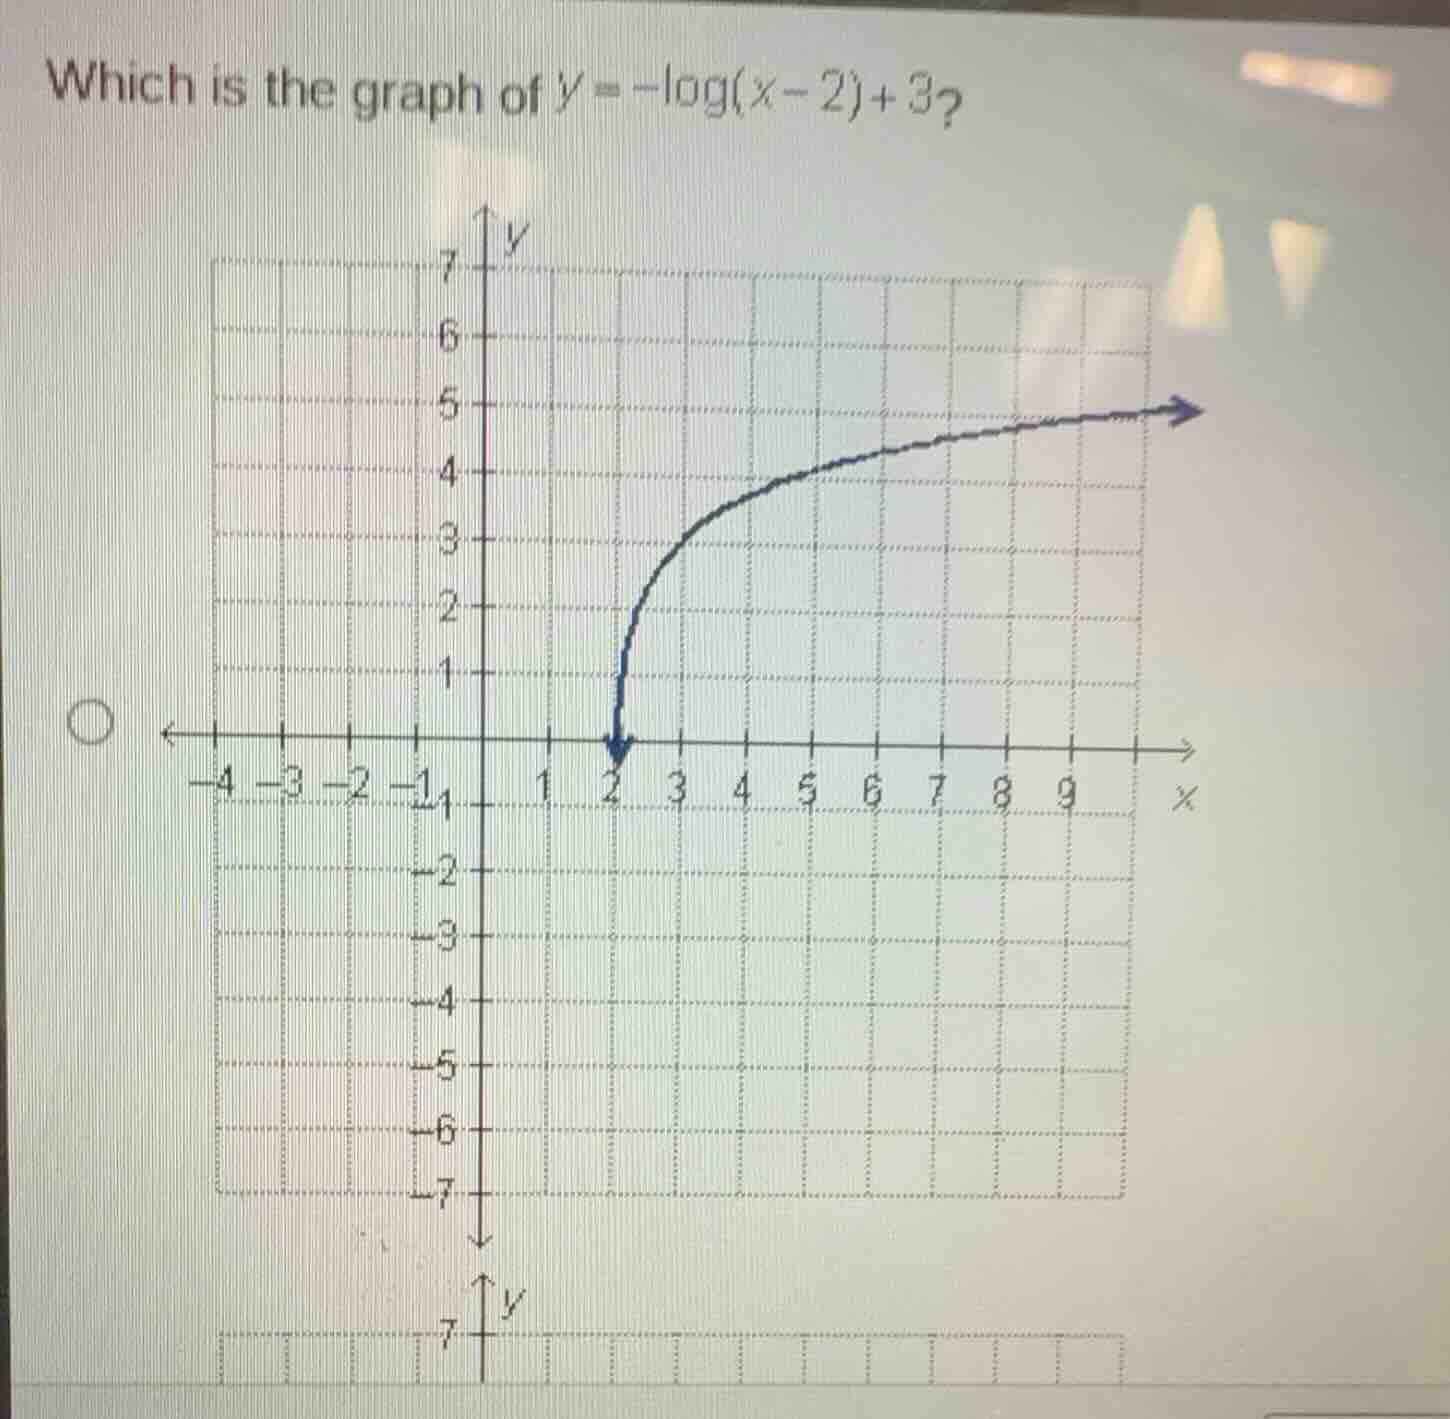
which is the graph of \\(y = -\log(x - 2) + 3\\)?
<pre_analysis>
{
"quality": "clear",
"question_count": 1,
"skills_matched": [
"step_cot",
"multiple_choice_formatter",
"explain_then_answer",
"tutor"
],
"needs_drawing": true,
"concepts_used": [
"Logarithmic Transformations",
"Logarithmic Domain"
],
"new_concepts": [
"Logarithmic Graphing",
"Vertical Reflection"
],
"current_concepts": [
"Logarithmic Transformations",
"Logarithmic Domain",
"Logarithmic Graphing",
"Vertical Reflection"
]
}
</pre_analysis>
<reasoning>
Identify the vertical asymptote
Using the Logarithmic Domain knowledge point, the argument of the logarithm must be strictly positive:
\[
x - 2 > 0 \implies x > 2
\]
This means there is a vertical asymptote at \(x = 2\).
Analyze transformations
Using the Logarithmic Transformations knowledge point, we analyze the parent function \(y = \log(x)\):
- Horizontal shift: \(x \to x - 2\) shifts the graph right by 2 units.
- Vertical reflection: The negative sign in \(-\log(x-2)\) reflects the graph vertically across the horizontal line of translation.
- Vertical shift: The \(+3\) shifts the graph upward by 3 units.
Evaluate key points
We calculate specific coordinate points to identify the correct graph:
- For \(x = 3\):
\[
y = -\log_{10}(3 - 2) + 3 = -\log_{10}(1) + 3 = 0 + 3 = 3
\]
So, the point \((3, 3)\) must lie on the graph.
- For \(x = 12\) (assuming base 10):
\[
y = -\log_{10}(12 - 2) + 3 = -\log_{10}(10) + 3 = -1 + 3 = 2
\]
So, the point \((12, 2)\) lies on the graph.
Compare with the given image
The graph shown in the image has:
- A vertical asymptote at \(x = 2\).
- A point at \((3, 3)\).
- A point at \((12, 2)\) (the curve decreases slowly as \(x\) increases).
- As \(x \to 2^+\), \(y \to \infty\) because \(-\log(x-2) \to \infty\).
The graph in the image matches all these characteristics.
</reasoning>
<answer>
<mcq-correct>(A) The graph shown in the image, which has a vertical asymptote at \(x = 2\), passes through \((3, 3)\), and decreases as \(x\) increases.</mcq-correct>
<mcq-option>(B) A graph with a vertical asymptote at \(x = -2\).</mcq-option>
<mcq-option>(C) A graph that increases as \(x\) increases from the asymptote \(x = 2\).</mcq-option>
<mcq-option>(D) A graph with a vertical asymptote at \(x = 3\).</mcq-option>
</answer>
<plot>
{
"elements": [
{
"type": "line",
"params": [[2, -10], [2, 10]],
"properties": {
"strokeColor": "#F2557F",
"strokeWidth": 1.5,
"dash": 2,
"name": "x = 2",
"withLabel": true
}
},
{
"type": "functiongraph",
"params": [
{
"js": "-Math.log(x - 2)/Math.log(10) + 3",
"latex": "-\log_{10}(x-2)+3"
},
2.001,
10
],
"properties": {
"strokeColor": "#8C55F2",
"strokeWidth": 2.5
}
},
{
"type": "point",
"params": [[3, 3]],
"properties": {
"name": "(3,3)",
"color": "#5583F2",
"size": 4,
"withLabel": true
}
}
],
"timestamps": [0.5, 1.0]
}
</plot>
<post_analysis>
{
"subject": "Mathematics",
"question_type": "Multiple Choice",
"knowledge_point": [
"Mathematics",
"Algebra",
"Logarithmic Transformations"
]
}
</post_analysis>

Snap & solve any problem in the app
Get step-by-step solutions on Sovi AI
Photo-based solutions with guided steps
Explore more problems and detailed explanations
<pre_analysis>
{
"quality": "clear",
"question_count": 1,
"skills_matched": [
"step_cot",
"multiple_choice_formatter",
"explain_then_answer",
"tutor"
],
"needs_drawing": true,
"concepts_used": [
"Logarithmic Transformations",
"Logarithmic Domain"
],
"new_concepts": [
"Logarithmic Graphing",
"Vertical Reflection"
],
"current_concepts": [
"Logarithmic Transformations",
"Logarithmic Domain",
"Logarithmic Graphing",
"Vertical Reflection"
]
}
</pre_analysis>
<reasoning>
Identify the vertical asymptote
Using the Logarithmic Domain knowledge point, the argument of the logarithm must be strictly positive:
\[
x - 2 > 0 \implies x > 2
\]
This means there is a vertical asymptote at \(x = 2\).
Analyze transformations
Using the Logarithmic Transformations knowledge point, we analyze the parent function \(y = \log(x)\):
- Horizontal shift: \(x \to x - 2\) shifts the graph right by 2 units.
- Vertical reflection: The negative sign in \(-\log(x-2)\) reflects the graph vertically across the horizontal line of translation.
- Vertical shift: The \(+3\) shifts the graph upward by 3 units.
Evaluate key points
We calculate specific coordinate points to identify the correct graph:
- For \(x = 3\):
\[
y = -\log_{10}(3 - 2) + 3 = -\log_{10}(1) + 3 = 0 + 3 = 3
\]
So, the point \((3, 3)\) must lie on the graph.
- For \(x = 12\) (assuming base 10):
\[
y = -\log_{10}(12 - 2) + 3 = -\log_{10}(10) + 3 = -1 + 3 = 2
\]
So, the point \((12, 2)\) lies on the graph.
Compare with the given image
The graph shown in the image has:
- A vertical asymptote at \(x = 2\).
- A point at \((3, 3)\).
- A point at \((12, 2)\) (the curve decreases slowly as \(x\) increases).
- As \(x \to 2^+\), \(y \to \infty\) because \(-\log(x-2) \to \infty\).
The graph in the image matches all these characteristics.
</reasoning>
<answer>
<mcq-correct>(A) The graph shown in the image, which has a vertical asymptote at \(x = 2\), passes through \((3, 3)\), and decreases as \(x\) increases.</mcq-correct>
<mcq-option>(B) A graph with a vertical asymptote at \(x = -2\).</mcq-option>
<mcq-option>(C) A graph that increases as \(x\) increases from the asymptote \(x = 2\).</mcq-option>
<mcq-option>(D) A graph with a vertical asymptote at \(x = 3\).</mcq-option>
</answer>
<plot>
{
"elements": [
{
"type": "line",
"params": [[2, -10], [2, 10]],
"properties": {
"strokeColor": "#F2557F",
"strokeWidth": 1.5,
"dash": 2,
"name": "x = 2",
"withLabel": true
}
},
{
"type": "functiongraph",
"params": [
{
"js": "-Math.log(x - 2)/Math.log(10) + 3",
"latex": "-\log_{10}(x-2)+3"
},
2.001,
10
],
"properties": {
"strokeColor": "#8C55F2",
"strokeWidth": 2.5
}
},
{
"type": "point",
"params": [[3, 3]],
"properties": {
"name": "(3,3)",
"color": "#5583F2",
"size": 4,
"withLabel": true
}
}
],
"timestamps": [0.5, 1.0]
}
</plot>
<post_analysis>
{
"subject": "Mathematics",
"question_type": "Multiple Choice",
"knowledge_point": [
"Mathematics",
"Algebra",
"Logarithmic Transformations"
]
}
</post_analysis>