QUESTION IMAGE
Question
part c: free response questions.
you must show some work to get full credit.
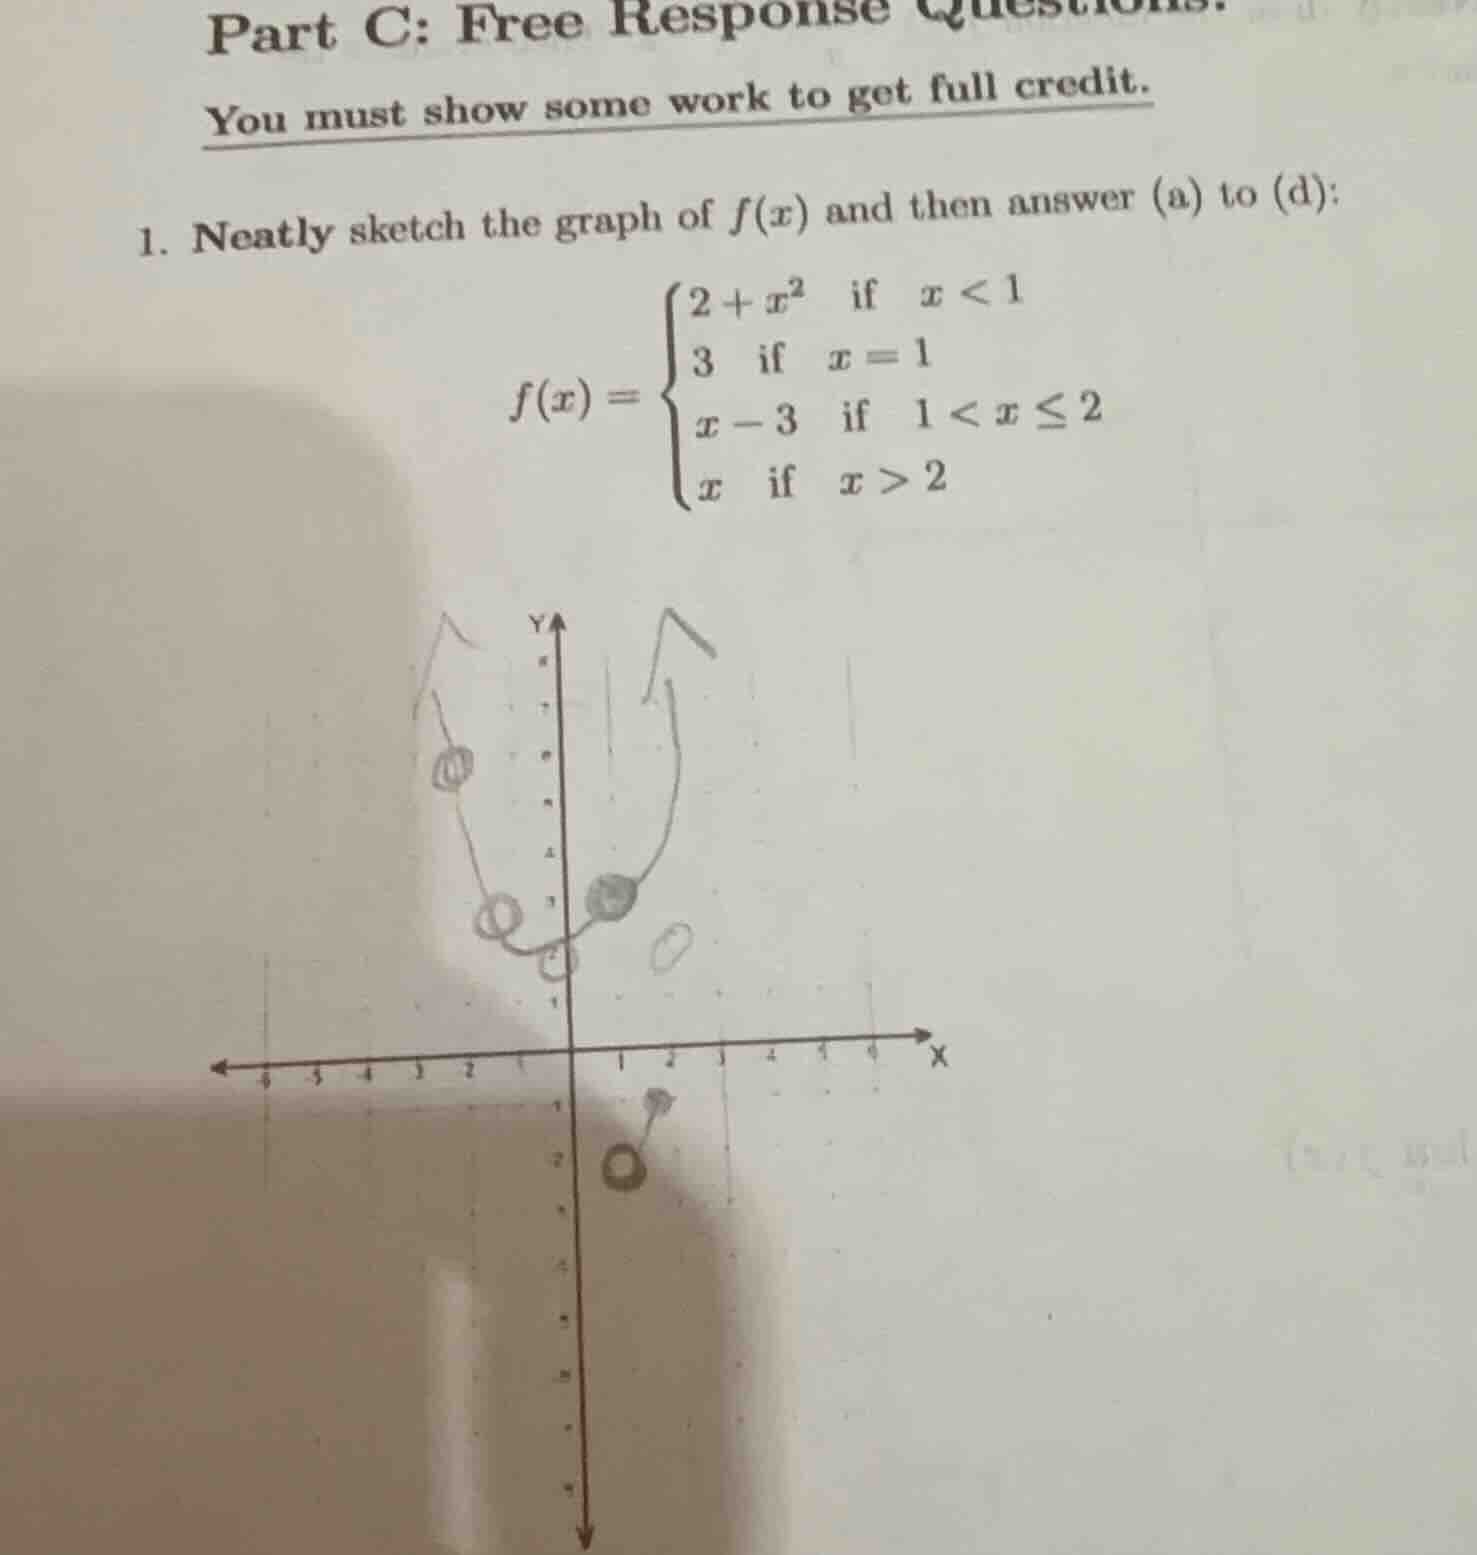
- neatly sketch the graph of \\(f(x)\\) and then answer (a) to (d):
\\f(x) = \
$$\begin{cases} 2 + x^2 & \\text{if } x < 1 \\\\ 3 & \\text{if } x = 1 \\\\ x - 3 & \\text{if } 1 < x \\le 2 \\\\ x & \\text{if } x > 2 \\end{cases}$$
\\
Analyze each piece of the function
We analyze the given piecewise function:
$$
f(x) =
LATEXBLOCK0
$$
Using the Piecewise Functions knowledge point, we identify the domain intervals and corresponding formulas.
Determine key points and boundary behavior
Using the Graphing Functions knowledge point, we evaluate the boundary values:
- For \(x < 1\), \(f(x) = 2 + x^2\). This is a parabola opening upwards with vertex at \((0, 2)\). As \(x \to 1^-\), \(f(x) \to 3\). Since \(x < 1\), there is an open circle at \((1, 3)\).
- For \(x = 1\), \(f(1) = 3\). This is represented by a solid point at \((1, 3)\). Since the open circle from the first piece and this solid point coincide, the point \((1, 3)\) is filled.
- For \(1 < x \le 2\), \(f(x) = x - 3\). This is a linear segment. At the left boundary \(x \to 1^+\), \(f(x) \to -2\) (open circle at \((1, -2)\)). At the right boundary \(x = 2\), \(f(2) = -1\) (solid point at \((2, -1)\)).
- For \(x > 2\), \(f(x) = x\). This is a ray. As \(x \to 2^+\), \(f(x) \to 2\) (open circle at \((2, 2)\)).
Summarize key features for sketching
We compile the critical features to sketch:
- A parabolic curve \(y = x^2 + 2\) for \(x < 1\), passing through \((0,2)\), \((-1,3)\), \((-2,6)\), ending at a solid point at \((1,3)\) because the point \(f(1)=3\) fills the limit hole.
- A line segment \(y = x - 3\) from \(x = 1\) to \(x = 2\), starting with an open circle at \((1, -2)\) and ending with a solid point at \((2, -1)\).
- A ray \(y = x\) starting with an open circle at \((2, 2)\) and extending upwards to the right through \((3,3)\), \((4,4)\).

Snap & solve any problem in the app
Get step-by-step solutions on Sovi AI
Photo-based solutions with guided steps
Explore more problems and detailed explanations
To neatly sketch the graph of the piecewise function \(f(x)\), plot the following key features on your coordinate plane:
- For \(x \le 1\):
- Draw the left half of the parabola \(y = x^2 + 2\).
- Key points to plot: \((-2, 6)\), \((-1, 3)\), and \((0, 2)\).
- Plot a solid circle at \((1, 3)\) because the limit from the left is \(3\) and the function value is explicitly defined as \(f(1) = 3\).
- For \(1 < x \le 2\):
- Draw a straight line segment for \(y = x - 3\).
- Plot an open circle at \((1, -2)\).
- Plot a solid circle at \((2, -1)\).
- For \(x > 2\):
- Draw a ray along the line \(y = x\).
- Plot an open circle at \((2, 2)\) and draw the line extending upwards to the right through points like \((3, 3)\) and \((4, 4)\).