QUESTION IMAGE
Question
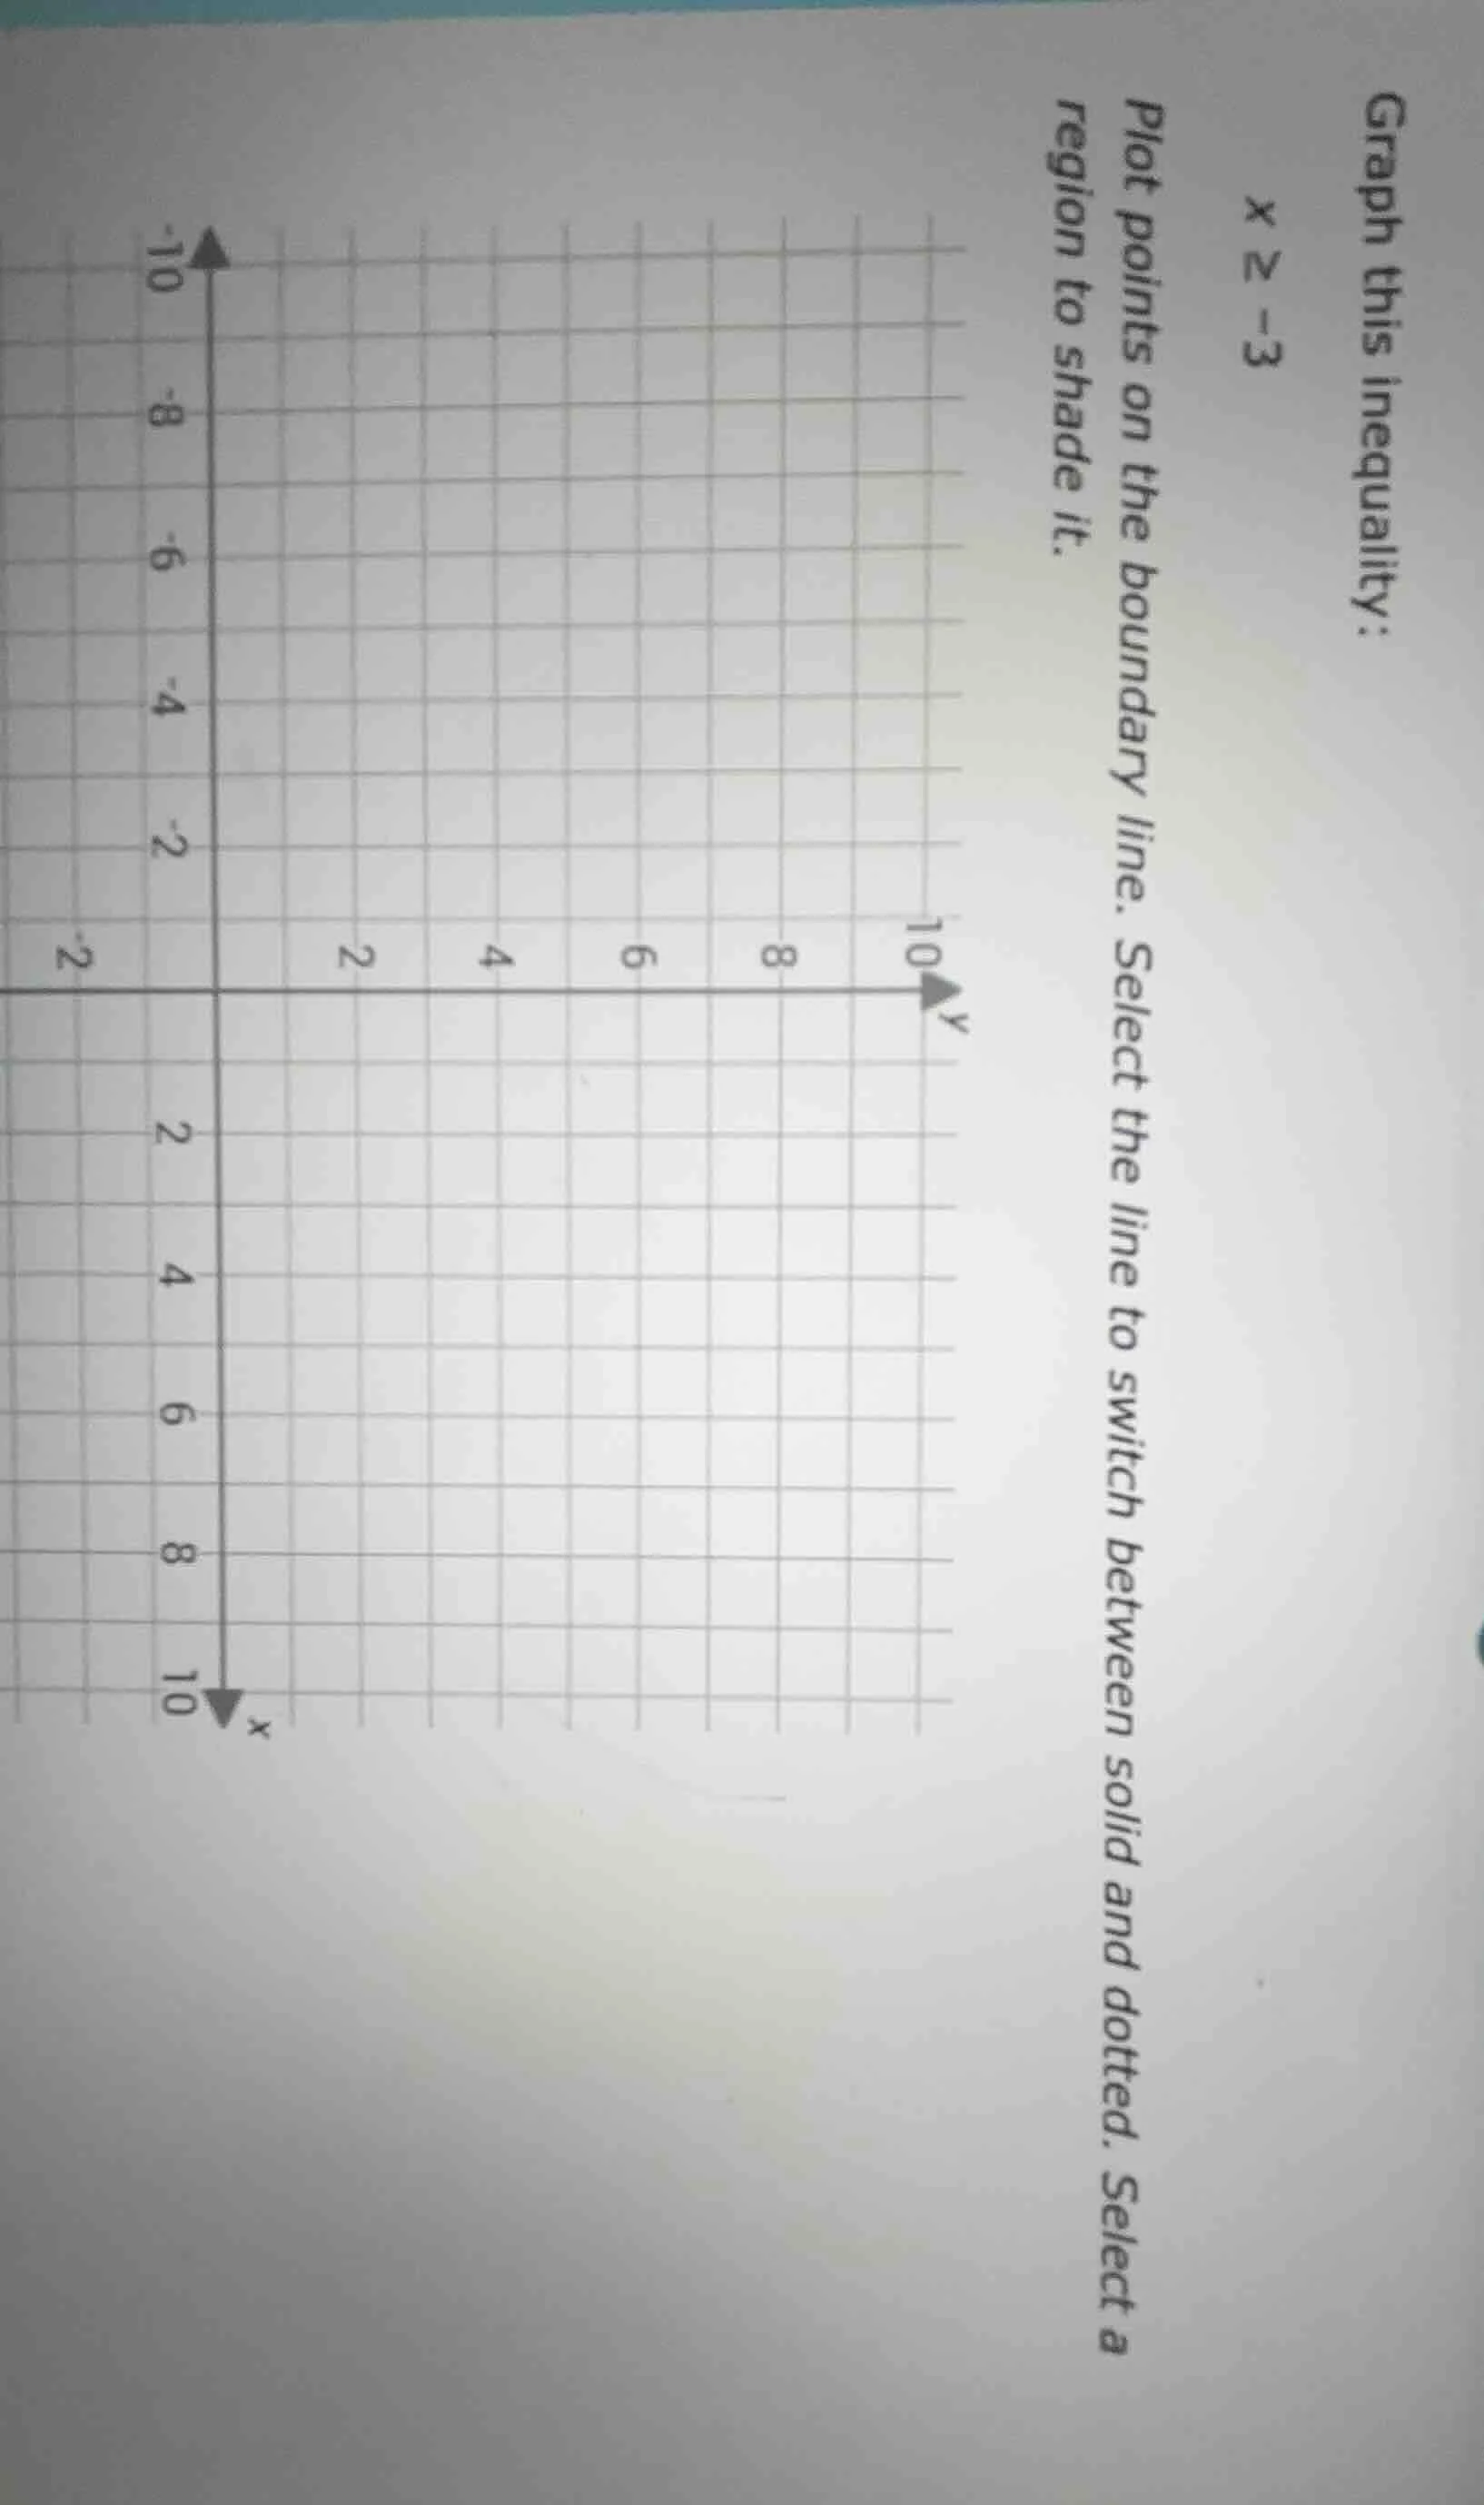
graph this inequality:
$x \geq -3$
plot points on the boundary line. select the line to switch between solid and dotted. select a region to shade it.
Step1: Identify boundary line
The boundary is $x=-3$, a vertical line. Since the inequality is $\geq$, use a solid line.
Step2: Plot boundary points
Plot points like $(-3, -2)$, $(-3, 0)$, $(-3, 2)$, $(-3, 4)$ and connect them to make the solid vertical line $x=-3$.
Step3: Determine shaded region
Test a point, e.g., $(0,0)$: $0 \geq -3$ is true. Shade the region to the right of $x=-3$ (all points where $x$ is greater than or equal to -3).

Snap & solve any problem in the app
Get step-by-step solutions on Sovi AI
Photo-based solutions with guided steps
Explore more problems and detailed explanations
- Boundary: Solid vertical line $x=-3$ passing through points $(-3, y)$ for any $y$-value.
- Shaded region: All area to the right of the line $x=-3$ (including the line itself).