QUESTION IMAGE
Question
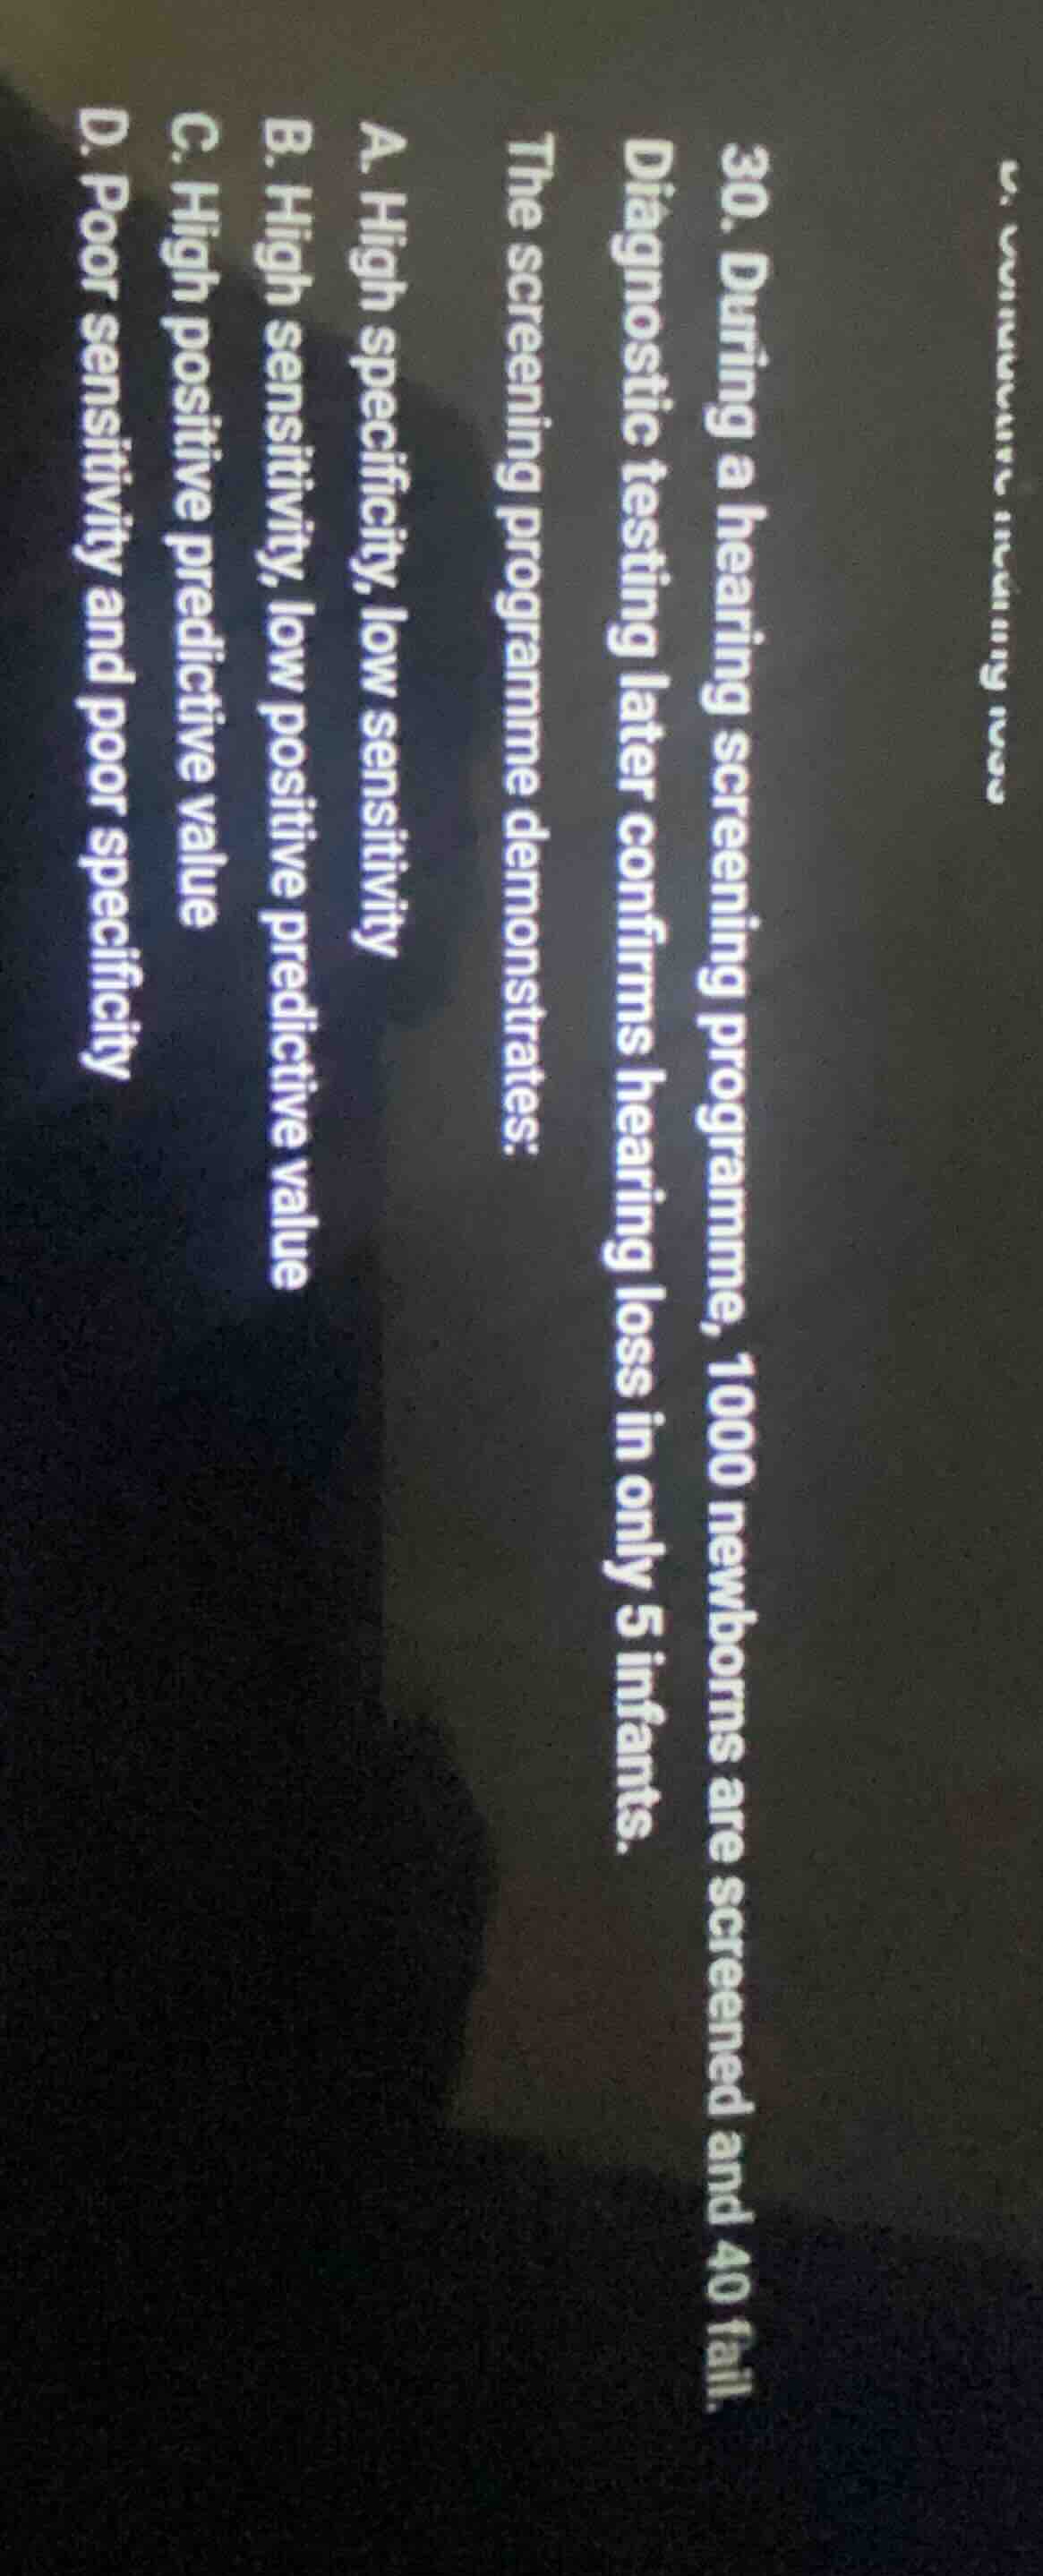
- during a hearing screening programme, 1000 newborns are screened and 40 fail. diagnostic testing later confirms hearing loss in only 5 infants.
the screening programme demonstrates:
a. high specificity, low sensitivity
b. high sensitivity, low positive predictive value
c. high positive predictive value
d. poor sensitivity and poor specificity
<pre_analysis>
{
"quality": "clear",
"question_count": 1,
"skills_matched": [
"step_cot",
"multiple_choice_formatter",
"explain_then_answer",
"tutor"
],
"needs_drawing": false,
"concepts_used": [],
"new_concepts": [
"Sensitivity and Specificity",
"Positive Predictive Value",
"Screening Test Metrics"
],
"current_concepts": [
"Sensitivity and Specificity",
"Positive Predictive Value",
"Screening Test Metrics"
]
}
</pre_analysis>
<reasoning>
Define the given parameters
We identify the key values from the screening scenario:
- Total newborns screened: \(1000\)
- Number of newborns who fail the screening (test positive): \(40\)
- Number of newborns confirmed with hearing loss (true cases): \(5\)
Analyze the positive predictive value
The positive predictive value (PPV) is the probability that a subject has the condition given a positive test result:
\[
\text{PPV} = \frac{\text{True Positives (TP)}}{\text{Total Test Positives}}
\]
Assuming all 5 confirmed cases were among the 40 who failed the screening (which is the standard assumption for a screening program where only those who fail are referred for diagnostic testing):
- \(\text{TP} = 5\)
- \(\text{Total Test Positives} = 40\)
- \(\text{PPV} = \frac{5}{40} = 12.5\%\)
A PPV of \(12.5\%\) is considered low because the vast majority of those who fail the screening (\(87.5\%\)) do not actually have the condition.
Analyze the sensitivity
Sensitivity is the probability that the test correctly identifies those with the condition:
\[
\text{Sensitivity} = \frac{\text{True Positives (TP)}}{\text{Total Diseased}}
\]
Since diagnostic testing confirmed hearing loss in 5 infants, and assuming the screening successfully detected them:
- \(\text{TP} = 5\)
- \(\text{Total Diseased} = 5\)
- \(\text{Sensitivity} = \frac{5}{5} = 100\%\)
Even if there were undetected cases (false negatives), detecting all 5 confirmed cases indicates a high sensitivity. Screening programs are designed to have high sensitivity to avoid missing any affected individuals.
Match with the options
We evaluate the calculated metrics against the choices:
- High sensitivity: Correct, as it is designed to catch all true cases.
- Low positive predictive value: Correct, as only \(12.5\%\) of those who failed actually had the disease.
This matches option B.
</reasoning>
<answer>
<mcq-option>(A) High specificity, low sensitivity</mcq-option>
<mcq-correct>(B) High sensitivity, low positive predictive value</mcq-correct>
<mcq-option>(C) High positive predictive value</mcq-option>
<mcq-option>(D) Poor sensitivity and poor specificity</mcq-option>
</answer>
<post_analysis>
{
"subject": "Natural Science",
"question_type": "Multiple Choice",
"knowledge_point": [
"Natural Science",
"Medicine",
"Epidemiology and Biostatistics"
]
}
</post_analysis>

Snap & solve any problem in the app
Get step-by-step solutions on Sovi AI
Photo-based solutions with guided steps
Explore more problems and detailed explanations
<pre_analysis>
{
"quality": "clear",
"question_count": 1,
"skills_matched": [
"step_cot",
"multiple_choice_formatter",
"explain_then_answer",
"tutor"
],
"needs_drawing": false,
"concepts_used": [],
"new_concepts": [
"Sensitivity and Specificity",
"Positive Predictive Value",
"Screening Test Metrics"
],
"current_concepts": [
"Sensitivity and Specificity",
"Positive Predictive Value",
"Screening Test Metrics"
]
}
</pre_analysis>
<reasoning>
Define the given parameters
We identify the key values from the screening scenario:
- Total newborns screened: \(1000\)
- Number of newborns who fail the screening (test positive): \(40\)
- Number of newborns confirmed with hearing loss (true cases): \(5\)
Analyze the positive predictive value
The positive predictive value (PPV) is the probability that a subject has the condition given a positive test result:
\[
\text{PPV} = \frac{\text{True Positives (TP)}}{\text{Total Test Positives}}
\]
Assuming all 5 confirmed cases were among the 40 who failed the screening (which is the standard assumption for a screening program where only those who fail are referred for diagnostic testing):
- \(\text{TP} = 5\)
- \(\text{Total Test Positives} = 40\)
- \(\text{PPV} = \frac{5}{40} = 12.5\%\)
A PPV of \(12.5\%\) is considered low because the vast majority of those who fail the screening (\(87.5\%\)) do not actually have the condition.
Analyze the sensitivity
Sensitivity is the probability that the test correctly identifies those with the condition:
\[
\text{Sensitivity} = \frac{\text{True Positives (TP)}}{\text{Total Diseased}}
\]
Since diagnostic testing confirmed hearing loss in 5 infants, and assuming the screening successfully detected them:
- \(\text{TP} = 5\)
- \(\text{Total Diseased} = 5\)
- \(\text{Sensitivity} = \frac{5}{5} = 100\%\)
Even if there were undetected cases (false negatives), detecting all 5 confirmed cases indicates a high sensitivity. Screening programs are designed to have high sensitivity to avoid missing any affected individuals.
Match with the options
We evaluate the calculated metrics against the choices:
- High sensitivity: Correct, as it is designed to catch all true cases.
- Low positive predictive value: Correct, as only \(12.5\%\) of those who failed actually had the disease.
This matches option B.
</reasoning>
<answer>
<mcq-option>(A) High specificity, low sensitivity</mcq-option>
<mcq-correct>(B) High sensitivity, low positive predictive value</mcq-correct>
<mcq-option>(C) High positive predictive value</mcq-option>
<mcq-option>(D) Poor sensitivity and poor specificity</mcq-option>
</answer>
<post_analysis>
{
"subject": "Natural Science",
"question_type": "Multiple Choice",
"knowledge_point": [
"Natural Science",
"Medicine",
"Epidemiology and Biostatistics"
]
}
</post_analysis>