QUESTION IMAGE
Question
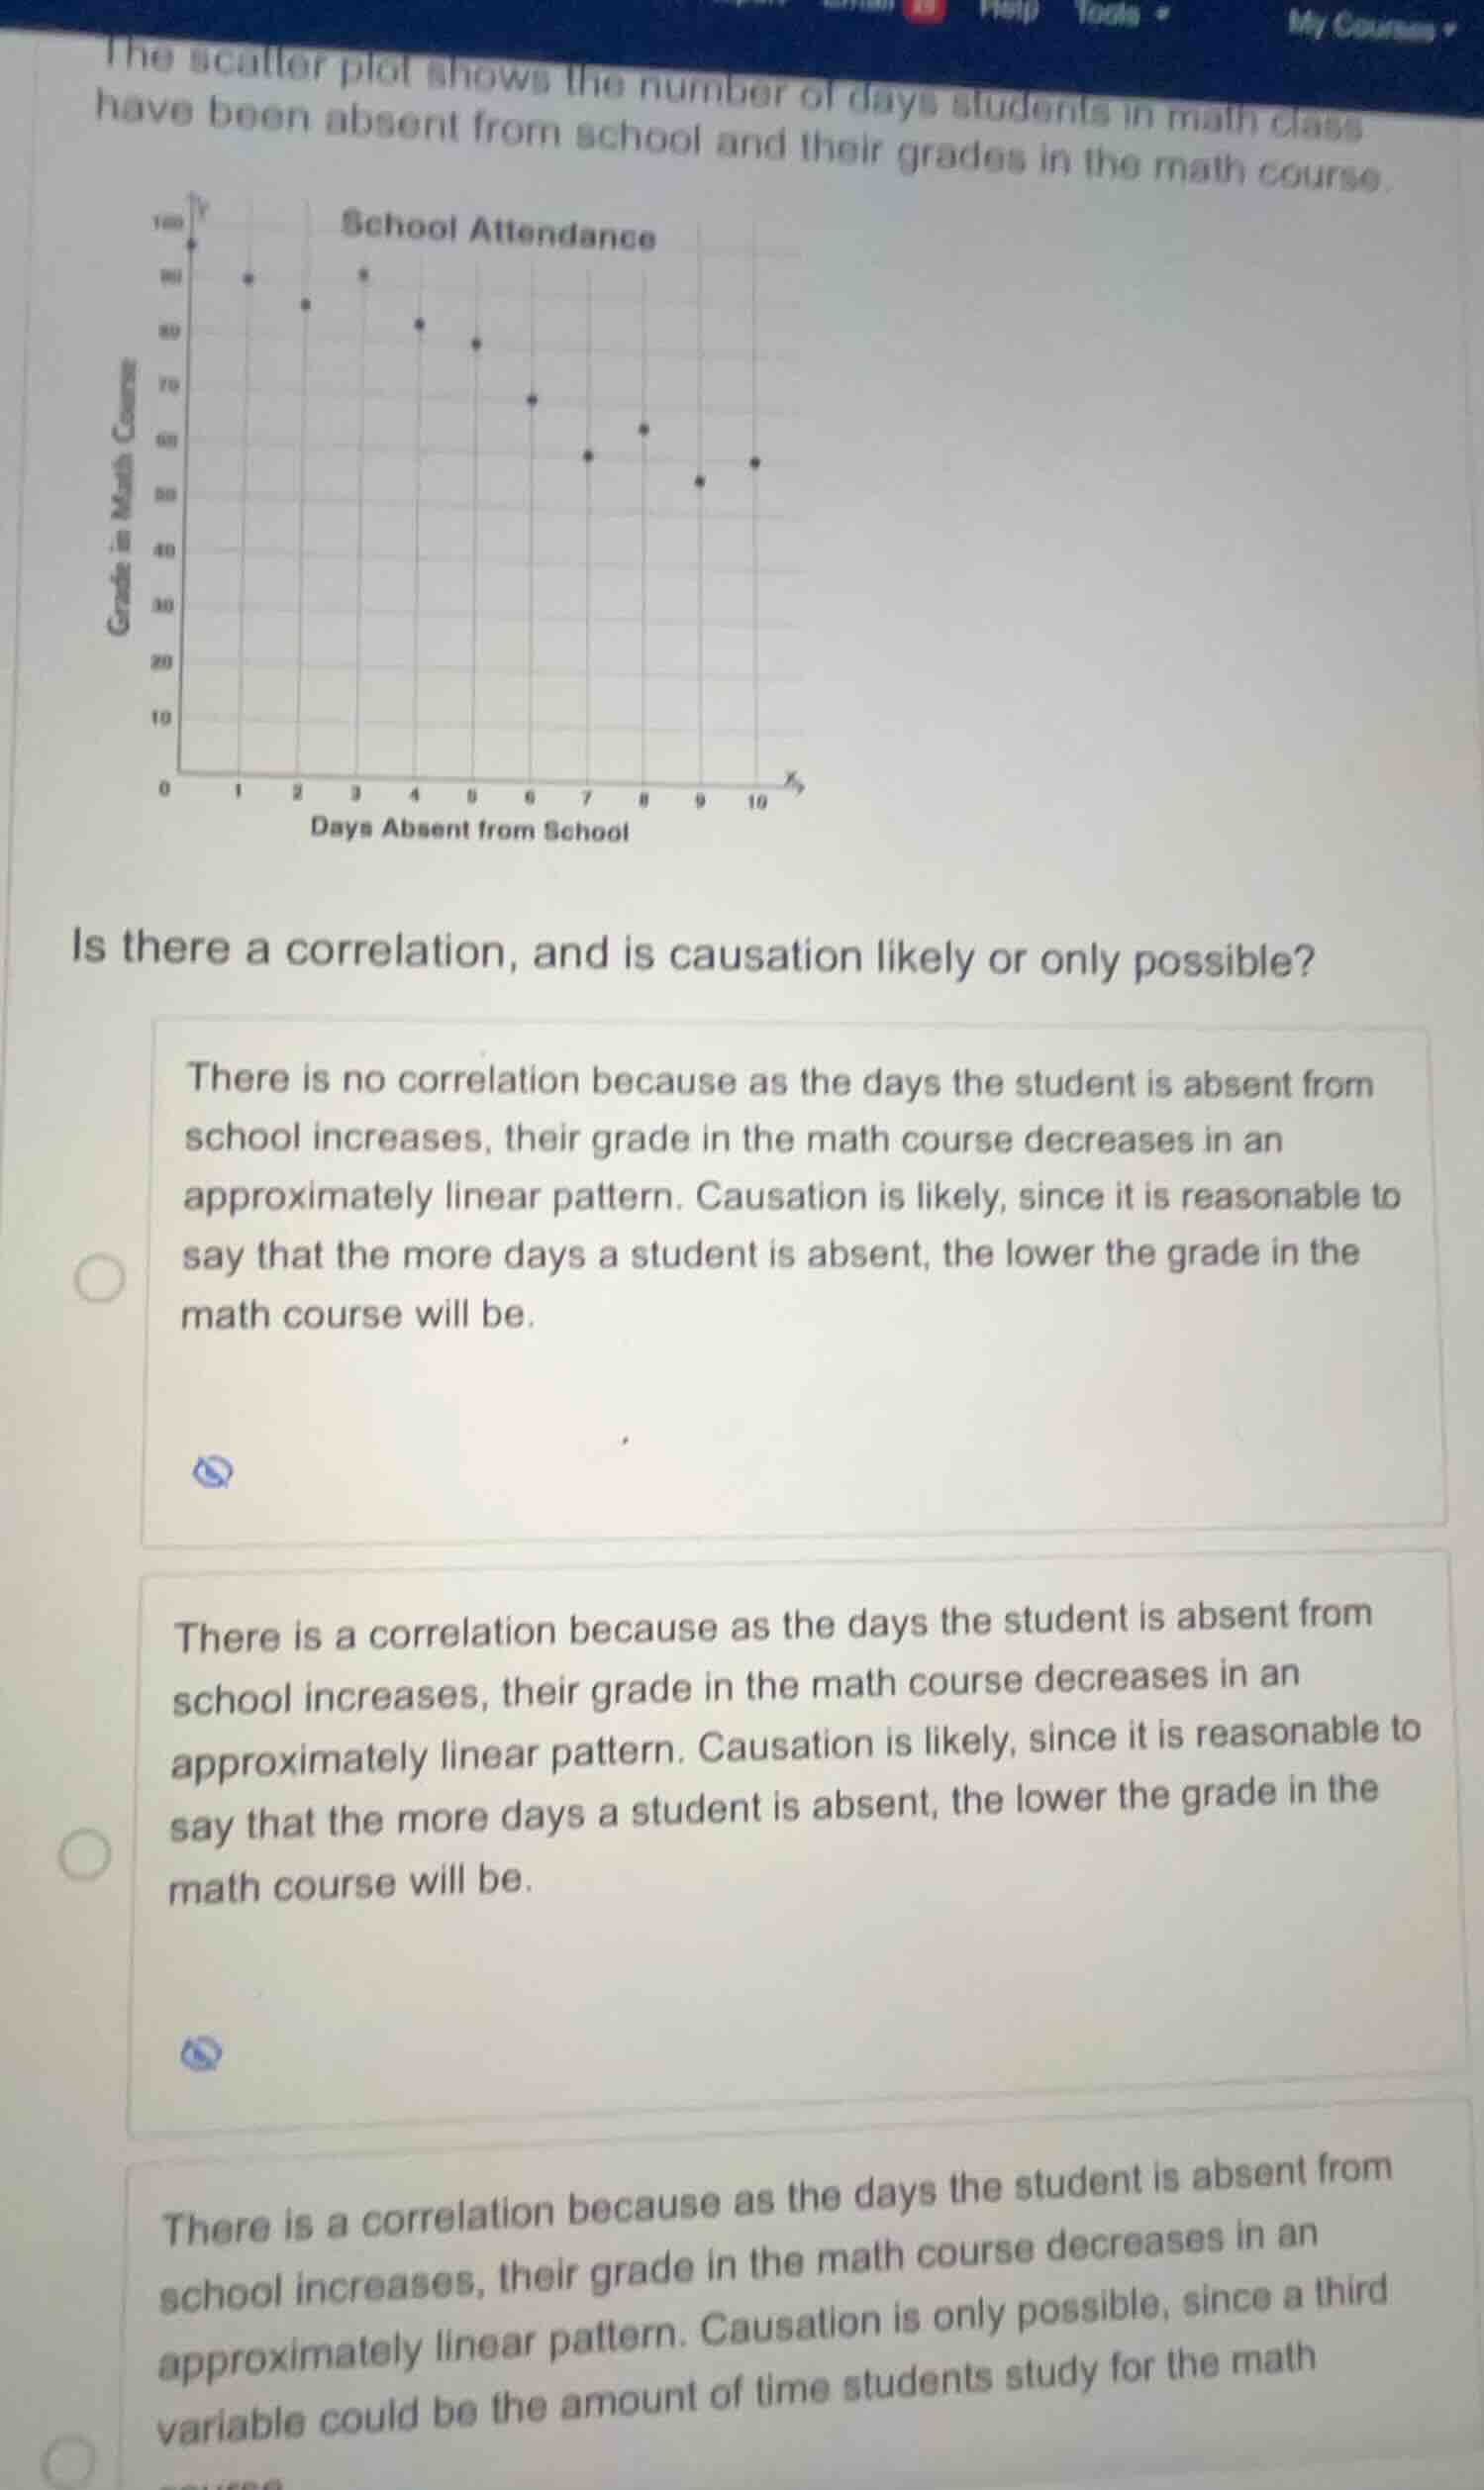
the scatter plot shows the number of days students in math class have been absent from school and their grades in the math course.
is there a correlation, and is causation likely or only possible?
there is no correlation because as the days the student is absent from school increases, their grade in the math course decreases in an approximately linear pattern. causation is likely, since it is reasonable to say that the more days a student is absent, the lower the grade in the math course will be.
there is a correlation because as the days the student is absent from school increases, their grade in the math course decreases in an approximately linear pattern. causation is likely, since it is reasonable to say that the more days a student is absent, the lower the grade in the math course will be.
there is a correlation because as the days the student is absent from school increases, their grade in the math course decreases in an approximately linear pattern. causation is only possible, since a third variable could be the amount of time students study for the math course.
<pre_analysis>
{
"quality": "clear",
"question_count": 1,
"skills_matched": [
"direct_cot",
"multiple_choice_formatter",
"explain_then_answer",
"tutor",
"mastery_adaptive_brevity"
],
"needs_drawing": false,
"concepts_used": [
"Scatter Plots",
"Correlation vs Causation",
"Lurking Variables"
],
"new_concepts": [],
"current_concepts": [
"Scatter Plots",
"Correlation vs Causation",
"Lurking Variables"
]
}
</pre_analysis>
<reasoning>
Analyze the scatter plot
Using the Scatter Plots knowledge point, we observe that as the number of days absent increases, the math grade generally decreases, showing a clear negative linear association.
Evaluate correlation vs causation
Using the Correlation vs Causation knowledge point, a strong negative relationship exists, meaning there is a correlation. However, direct causation is not guaranteed because other factors can influence grades.
Identify potential lurking variables
Using the Lurking Variables knowledge point, a third variable, such as study time, student motivation, or illness, could be driving both absences and lower grades, making causation only possible rather than likely.
Select the correct option
We compare our findings to the choices. The third option correctly states there is a correlation and that causation is only possible due to a third variable like study time.
</reasoning>
<answer>
<mcq-option>There is no correlation because as the days the student is absent from school increases, their grade in the math course decreases in an approximately linear pattern. Causation is likely, since it is reasonable to say that the more days a student is absent, the lower the grade in the math course will be.</mcq-option>
<mcq-option>There is a correlation because as the days the student is absent from school increases, their grade in the math course decreases in an approximately linear pattern. Causation is likely, since it is reasonable to say that the more days a student is absent, the lower the grade in the math course will be.</mcq-option>
<mcq-correct>There is a correlation because as the days the student is absent from school increases, their grade in the math course decreases in an approximately linear pattern. Causation is only possible, since a third variable could be the amount of time students study for the math course.</mcq-correct>
</answer>
<post_analysis>
{
"subject": "Mathematics",
"question_type": "Multiple Choice",
"knowledge_point": [
"Mathematics",
"Statistics",
"Correlation vs Causation"
]
}
</post_analysis>

Snap & solve any problem in the app
Get step-by-step solutions on Sovi AI
Photo-based solutions with guided steps
Explore more problems and detailed explanations
<pre_analysis>
{
"quality": "clear",
"question_count": 1,
"skills_matched": [
"direct_cot",
"multiple_choice_formatter",
"explain_then_answer",
"tutor",
"mastery_adaptive_brevity"
],
"needs_drawing": false,
"concepts_used": [
"Scatter Plots",
"Correlation vs Causation",
"Lurking Variables"
],
"new_concepts": [],
"current_concepts": [
"Scatter Plots",
"Correlation vs Causation",
"Lurking Variables"
]
}
</pre_analysis>
<reasoning>
Analyze the scatter plot
Using the Scatter Plots knowledge point, we observe that as the number of days absent increases, the math grade generally decreases, showing a clear negative linear association.
Evaluate correlation vs causation
Using the Correlation vs Causation knowledge point, a strong negative relationship exists, meaning there is a correlation. However, direct causation is not guaranteed because other factors can influence grades.
Identify potential lurking variables
Using the Lurking Variables knowledge point, a third variable, such as study time, student motivation, or illness, could be driving both absences and lower grades, making causation only possible rather than likely.
Select the correct option
We compare our findings to the choices. The third option correctly states there is a correlation and that causation is only possible due to a third variable like study time.
</reasoning>
<answer>
<mcq-option>There is no correlation because as the days the student is absent from school increases, their grade in the math course decreases in an approximately linear pattern. Causation is likely, since it is reasonable to say that the more days a student is absent, the lower the grade in the math course will be.</mcq-option>
<mcq-option>There is a correlation because as the days the student is absent from school increases, their grade in the math course decreases in an approximately linear pattern. Causation is likely, since it is reasonable to say that the more days a student is absent, the lower the grade in the math course will be.</mcq-option>
<mcq-correct>There is a correlation because as the days the student is absent from school increases, their grade in the math course decreases in an approximately linear pattern. Causation is only possible, since a third variable could be the amount of time students study for the math course.</mcq-correct>
</answer>
<post_analysis>
{
"subject": "Mathematics",
"question_type": "Multiple Choice",
"knowledge_point": [
"Mathematics",
"Statistics",
"Correlation vs Causation"
]
}
</post_analysis>