QUESTION IMAGE
Question
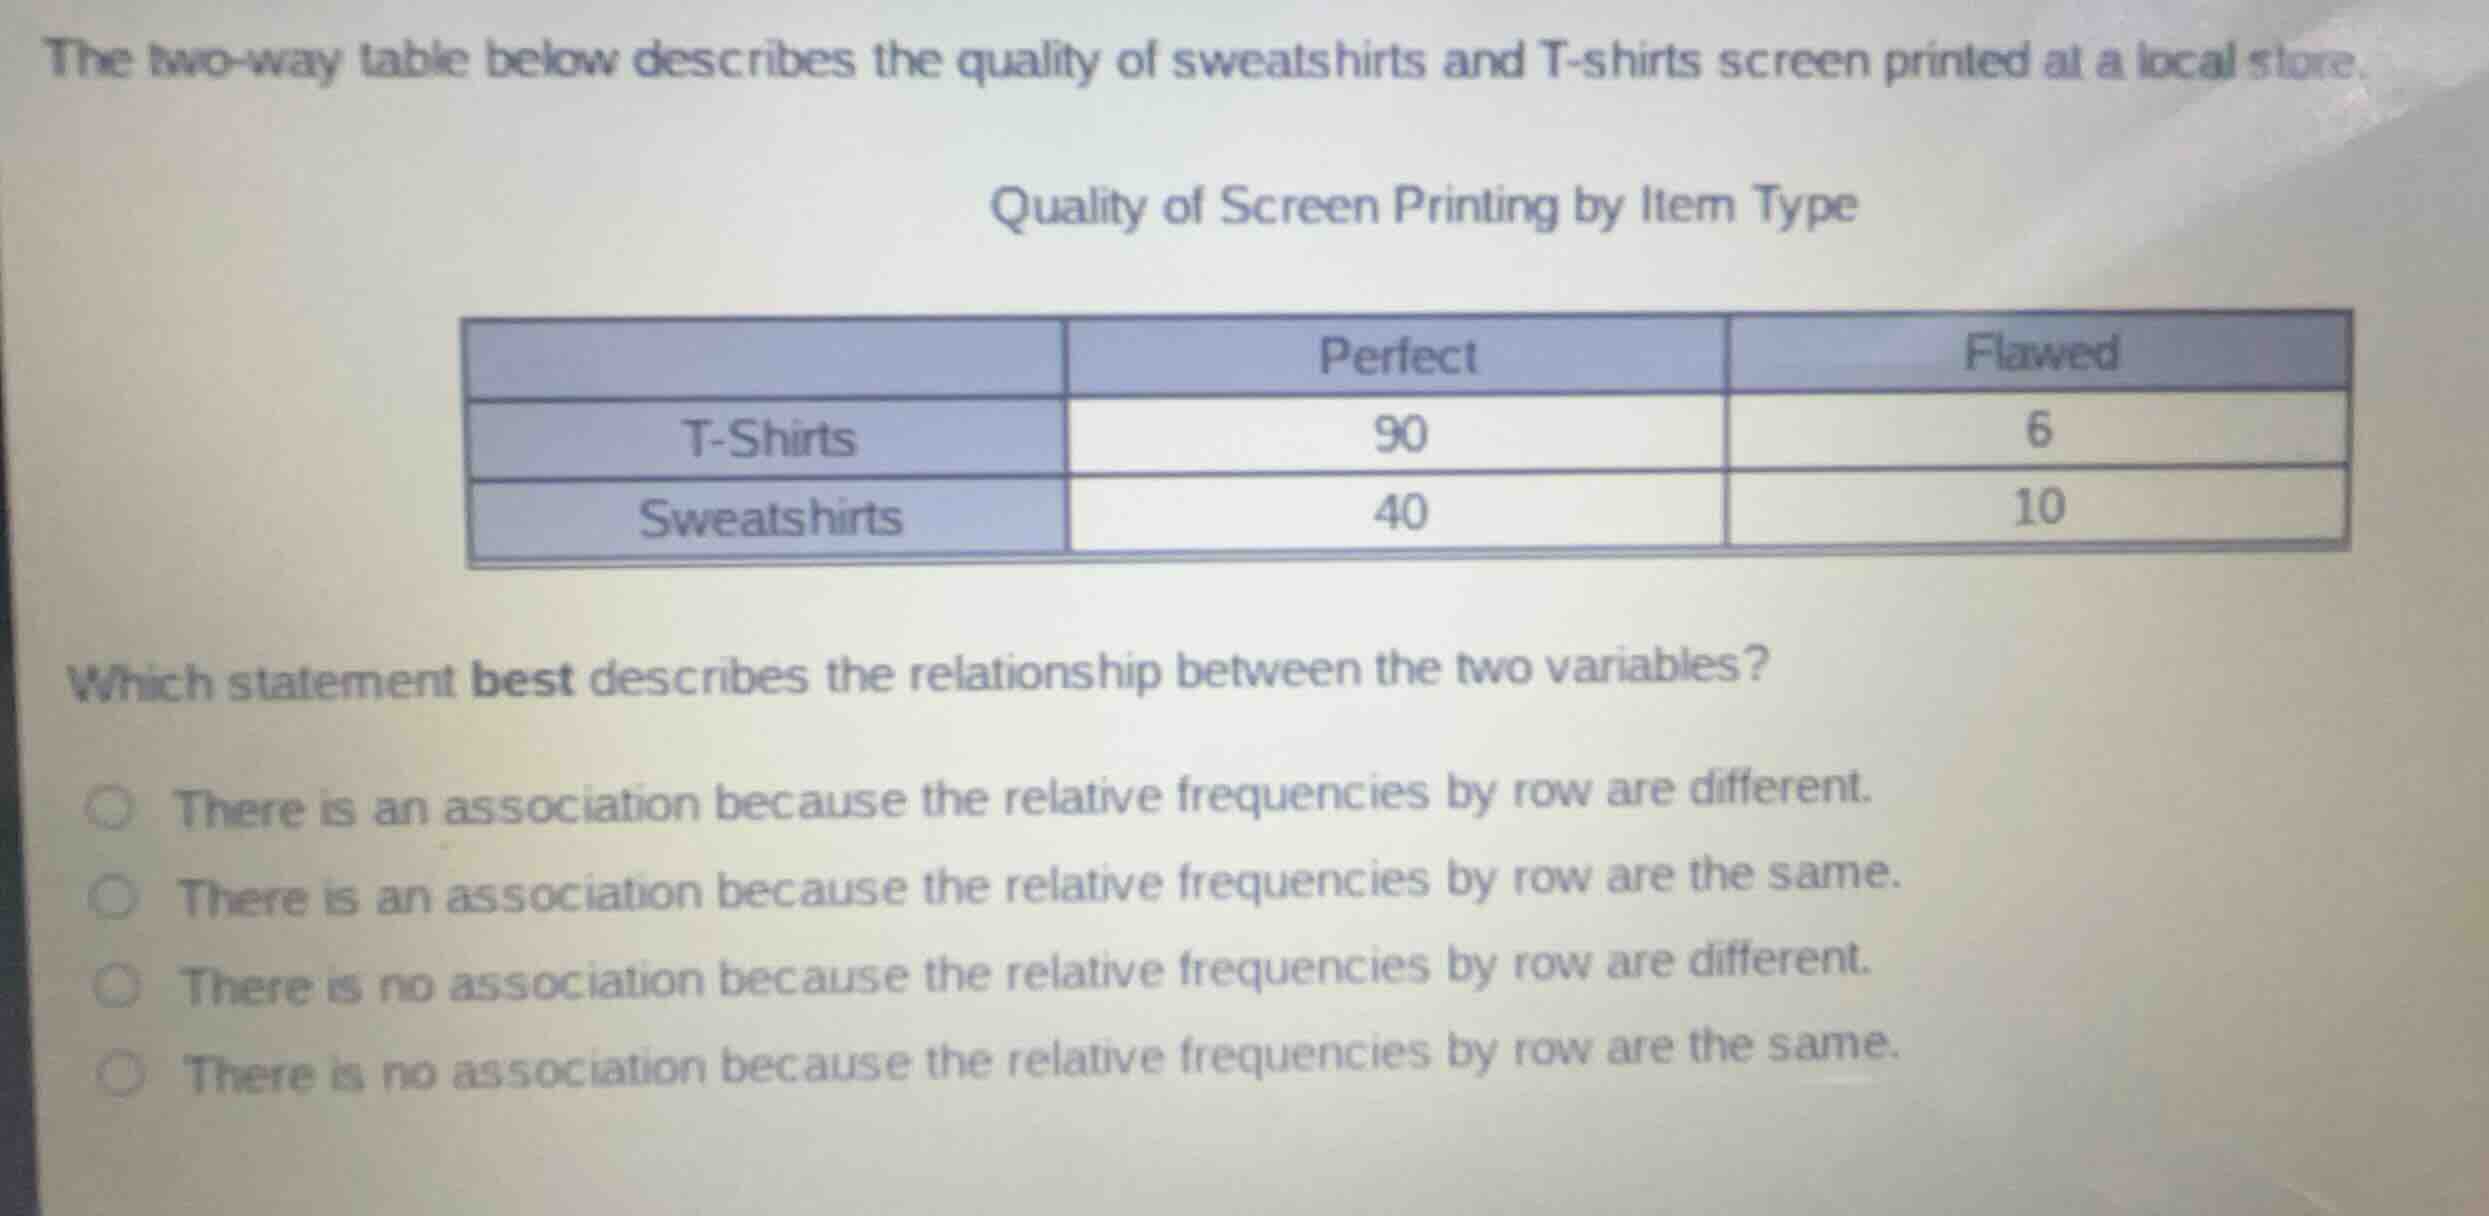
the two-way table below describes the quality of sweatshirts and t-shirts screen printed at a local store.
quality of screen printing by item type
| perfect | flawed | |
|---|---|---|
| sweatshirts | 40 | 10 |
which statement best describes the relationship between the two variables?
- there is an association because the relative frequencies by row are different.
- there is an association because the relative frequencies by row are the same.
- there is no association because the relative frequencies by row are different.
- there is no association because the relative frequencies by row are the same.
Calculate row relative frequencies
$$
LATEXBLOCK0
$$
Determine association
$$
LATEXBLOCK1
$$

Snap & solve any problem in the app
Get step-by-step solutions on Sovi AI
Photo-based solutions with guided steps
Explore more problems and detailed explanations
- (A) There is an association because the relative frequencies by row are different. (Correct answer)
- (B) There is an association because the relative frequencies by row are the same.
- (C) There is no association because the relative frequencies by row are different.
- (D) There is no association because the relative frequencies by row are the same.