QUESTION IMAGE
Question
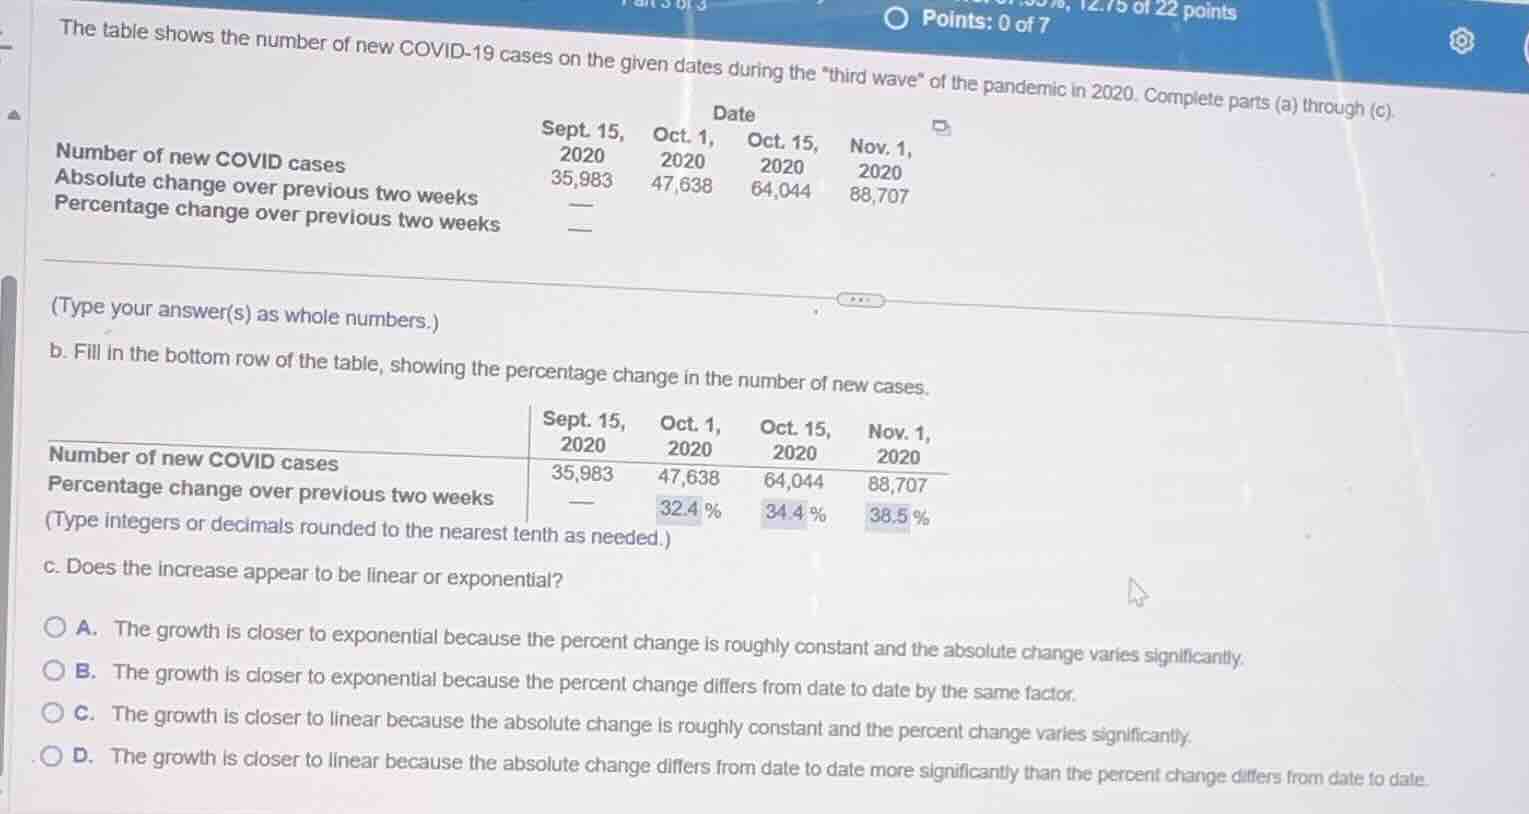
the table shows the number of new covid-19 cases on the given dates during the \third wave\ of the pandemic in 2020. complete parts (a) through (c).
\
(type your answer(s) as whole numbers.)
b. fill in the bottom row of the table, showing the percentage change in the number of new cases.
\
(type integers or decimals rounded to the nearest tenth as needed.)
c. does the increase appear to be linear or exponential?
a. the growth is closer to exponential because the percent change is roughly constant and the absolute change varies significantly.
b. the growth is closer to exponential because the percent change differs from date to date by the same factor.
c. the growth is closer to linear because the absolute change is roughly constant and the percent change varies significantly.
d. the growth is closer to linear because the absolute change differs from date to date more significantly than the percent change differs from date to date.
Analyze the given data
We are given the number of new COVID-19 cases on four dates, each separated by approximately two weeks:
- Sept. 15, 2020: \(35,983\)
- Oct. 1, 2020: \(47,638\)
- Oct. 15, 2020: \(64,044\)
- Nov. 1, 2020: \(88,707\)
We also have the calculated percentage changes over the previous two weeks:
- Oct. 1, 2020: \(32.4\%\)
- Oct. 15, 2020: \(34.4\%\)
- Nov. 1, 2020: \(38.5\%\)
Calculate absolute changes
Using the Absolute Change concept, we compute the differences between consecutive periods:
- From Sept. 15 to Oct. 1: \(47,638 - 35,983 = 11,655\)
- From Oct. 1 to Oct. 15: \(64,044 - 47,638 = 16,406\)
- From Oct. 15 to Nov. 1: \(88,707 - 64,044 = 24,663\)
The absolute change increases significantly over time (from \(11,655\) to \(24,663\)).
Compare growth models
Using the Linear Growth and Exponential Growth concepts:
- Linear Growth is characterized by a constant absolute change over equal time intervals. Here, the absolute change is not constant; it is growing rapidly.
- Exponential Growth is characterized by a constant percentage change (relative growth rate) over equal time intervals.
Using the Percentage Change concept, the percentage changes are \(32.4\%\), \(34.4\%\), and \(38.5\%\). These values are relatively close to each other (roughly constant, hovering around \(32\%\) to \(38\%\)), whereas the absolute changes vary significantly (nearly doubling from \(11,655\) to \(24,663\)).
Select the correct option
Therefore, the growth is closer to exponential because the percent change is roughly constant while the absolute change varies significantly. This matches option A.

Snap & solve any problem in the app
Get step-by-step solutions on Sovi AI
Photo-based solutions with guided steps
Explore more problems and detailed explanations
- (A) The growth is closer to exponential because the percent change is roughly constant and the absolute change varies significantly. (Correct answer)
- (B) The growth is closer to exponential because the percent change differs from date to date by the same factor.
- (C) The growth is closer to linear because the absolute change is roughly constant and the percent change varies significantly.
- (D) The growth is closer to linear because the absolute change differs from date to date more significantly than the percent change differs from date to date.