QUESTION IMAGE
Question
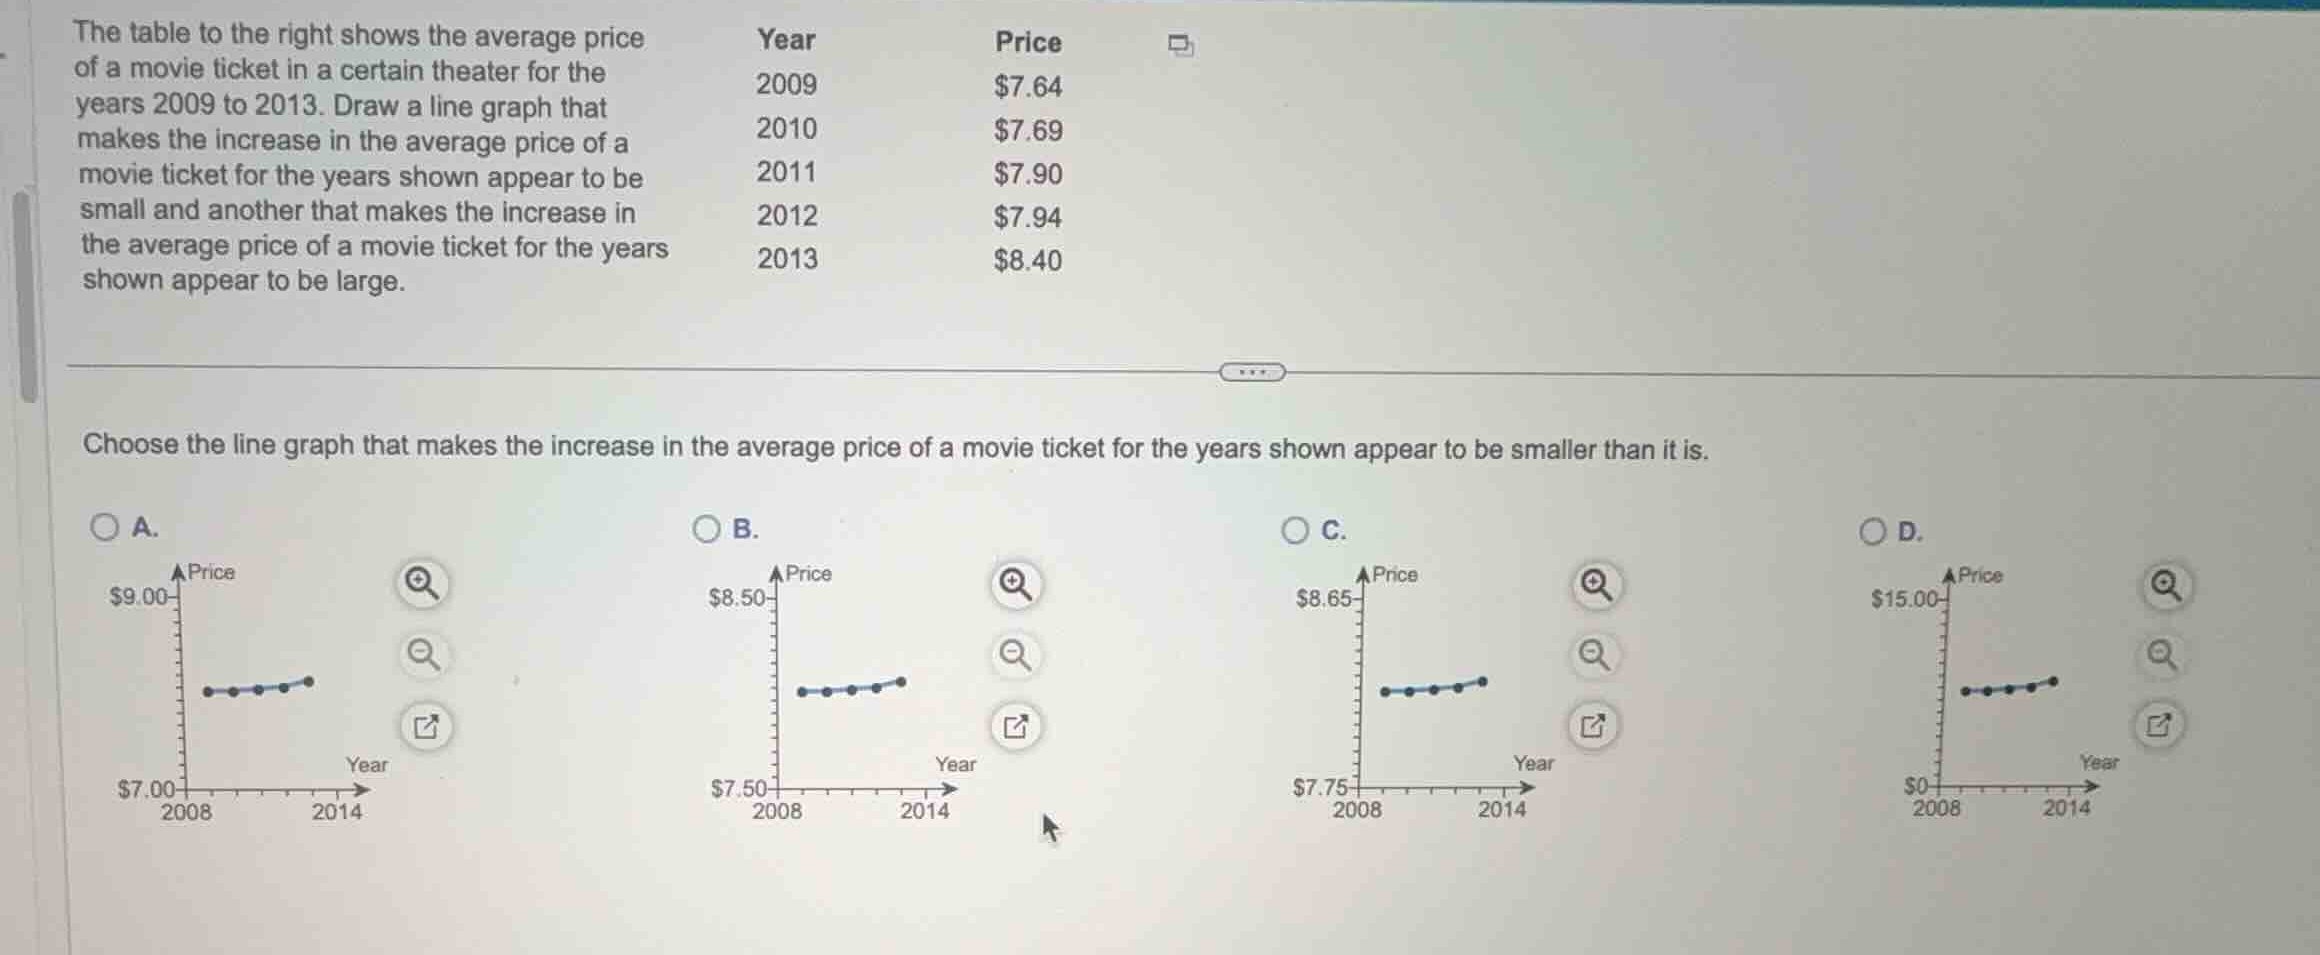
the table to the right shows the average price of a movie ticket in a certain theater for the years 2009 to 2013. draw a line graph that makes the increase in the average price of a movie ticket for the years shown appear to be small and another that makes the increase in the average price of a movie ticket for the years shown appear to be large.
year price
2009 $7.64
2010 $7.69
2011 $7.90
2012 $7.94
2013 $8.40
choose the line graph that makes the increase in the average price of a movie ticket for the years shown appear to be smaller than it is.
Analyze the effect of vertical axis scale
Using the Statistical Misinterpretation knowledge point, we analyze how the scale of the vertical axis (y-axis) affects the visual perception of data trends. When the vertical axis has a very large range (for example, starting at \$0 and going up to \$15.00), a small change in value (from \$7.64 to \$8.40, which is a difference of \$0.76) will occupy a very small fraction of the vertical space. This compresses the line vertically, making the increase appear extremely small or nearly flat.
Compare the vertical axis ranges of the options
We examine the y-axis range for each of the given choices:
- Graph A: The vertical axis ranges from \$7.00 to \$9.00 (a range of \$2.00).
- Graph B: The vertical axis ranges from \$7.50 to \$8.50 (a range of \$1.00).
- Graph C: The vertical axis ranges from \$7.75 to \$8.65 (a range of \$0.90).
- Graph D: The vertical axis ranges from \$0 to \$15.00 (a range of \$15.00).
Determine which graph minimizes the visual increase
The range of the actual data is from \$7.64 to \$8.40, which is a span of \$0.76.
In Graph D, the vertical range is \$15.00. The change of \$0.76 represents only about \(5\%\) of the total vertical height of the axis. Consequently, the line representing the prices over the years will look almost completely flat, making the increase in the average price of a movie ticket appear much smaller than it actually is.

Snap & solve any problem in the app
Get step-by-step solutions on Sovi AI
Photo-based solutions with guided steps
Explore more problems and detailed explanations
- (A) Graph with y-axis from \$7.00 to \$9.00
- (B) Graph with y-axis from \$7.50 to \$8.50
- (C) Graph with y-axis from \$7.75 to \$8.65
- (D) Graph with y-axis from \$0 to \$15.00 (Correct answer)