QUESTION IMAGE
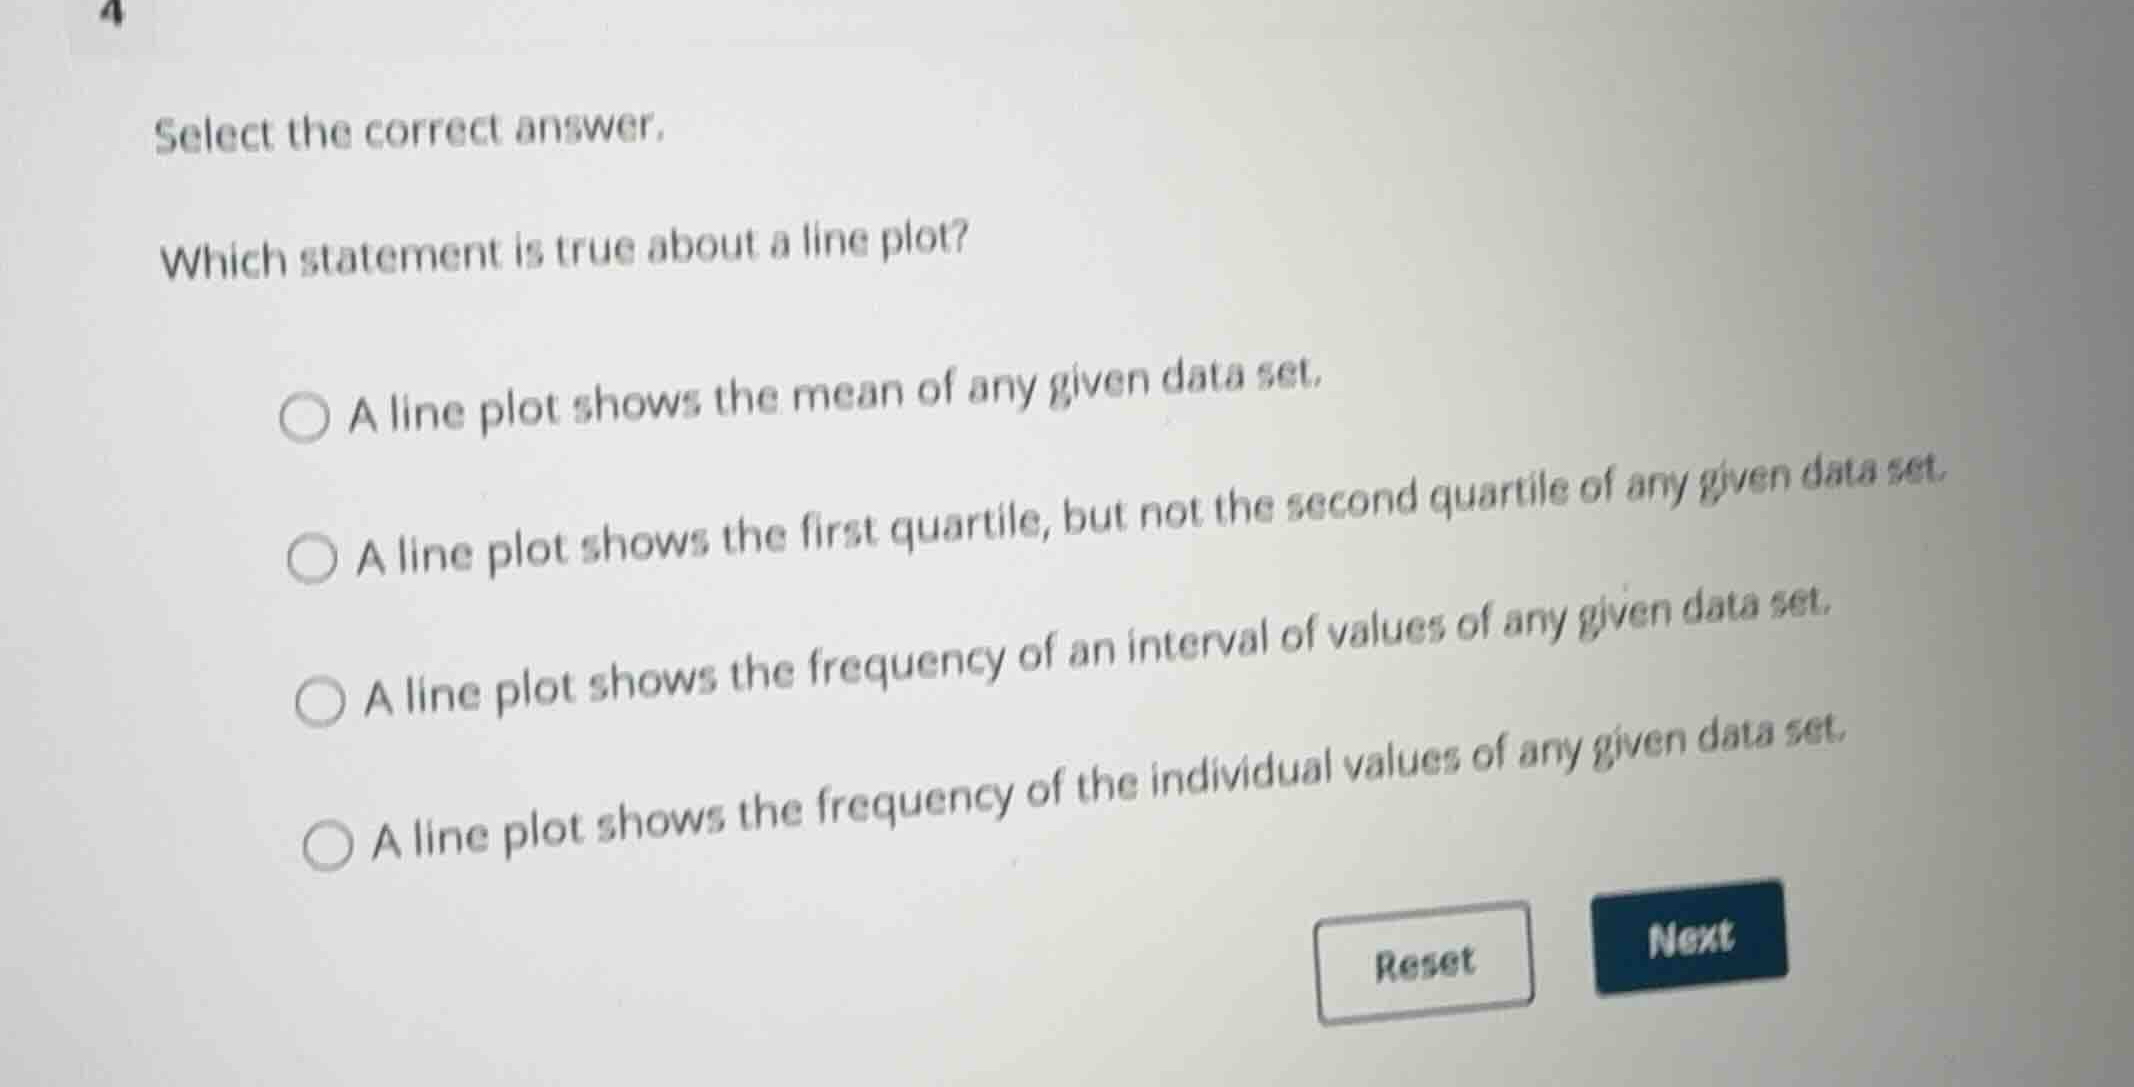
Question
select the correct answer.
which statement is true about a line plot?
- a line plot shows the mean of any given data set.
- a line plot shows the first quartile, but not the second quartile of any given data set.
- a line plot shows the frequency of an interval of values of any given data set.
- a line plot shows the frequency of the individual values of any given data set.
Define a line plot
A line plot (or dot plot) is a graph that displays the frequency of individual data values along a number line using dots, crosses, or other marks.
Evaluate the given options
- Option 1: A line plot does not directly show the mean; the mean must be calculated from the data.
- Option 2: Quartiles are typically shown on box plots, not line plots.
- Option 3: Histograms show the frequency of intervals of values, whereas line plots show individual values.
- Option 4: A line plot shows the frequency of each individual value in the data set.

Snap & solve any problem in the app
Get step-by-step solutions on Sovi AI
Photo-based solutions with guided steps
Explore more problems and detailed explanations
- A line plot shows the mean of any given data set.
- A line plot shows the first quartile, but not the second quartile of any given data set.
- A line plot shows the frequency of an interval of values of any given data set.
- A line plot shows the frequency of the individual values of any given data set. (Correct answer)