QUESTION IMAGE
Question
select the correct answer.
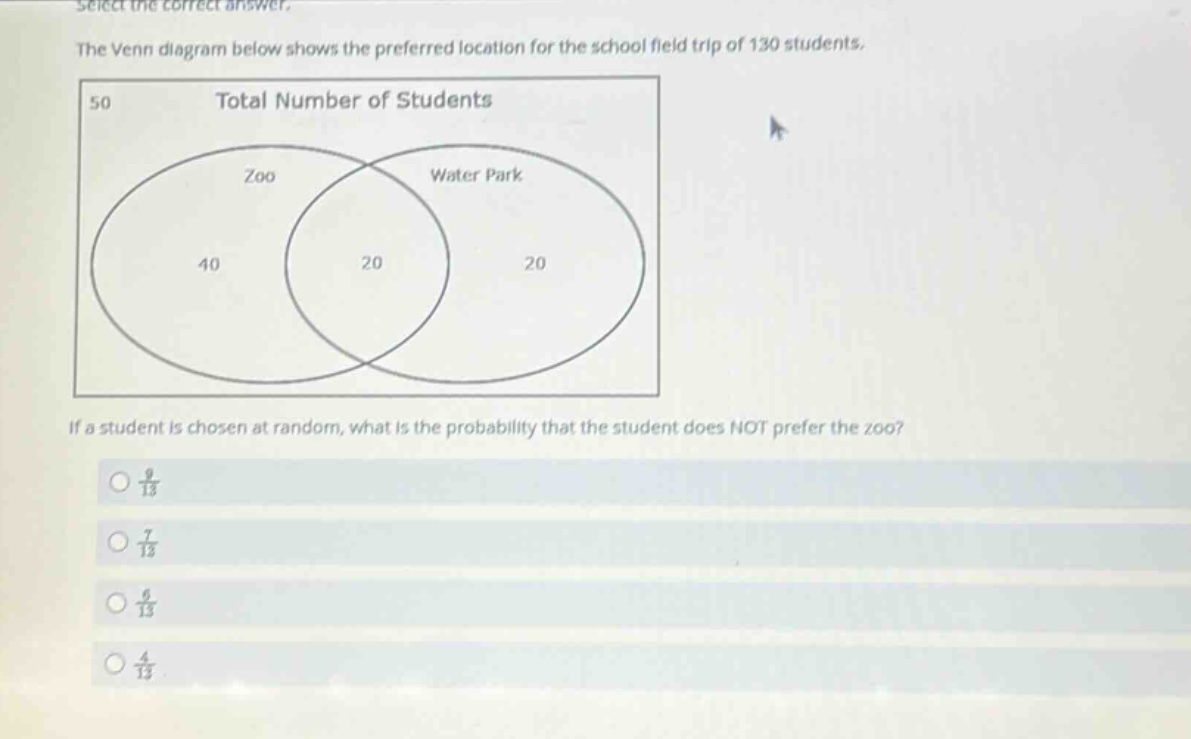
the venn diagram below shows the preferred location for the school field trip of 130 students.
if a student is chosen at random, what is the probability that the student does not prefer the zoo?
- \\(\frac{9}{13}\\)
- \\(\frac{7}{13}\\)
- \\(\frac{6}{13}\\)
- \\(\frac{4}{13}\\)
🆕 New Concept Discovered: Venn Diagrams and Probability
Finding chances using overlapping groups
Step 1: Identify the total number of students
The total number of students in the sample space is given in the problem description and can also be found by adding all the values in the Venn diagram:
Step 2: Identify the number of students who do NOT prefer the zoo
The "Zoo" circle contains two regions:
- Students who prefer only the Zoo: \( 40 \)
- Students who prefer both the Zoo and the Water Park: \( 20 \)
To find the number of students who do NOT prefer the zoo, we look at all regions outside the "Zoo" circle:
- Students who prefer only the Water Park: \( 20 \)
- Students who prefer neither (outside both circles): \( 50 \)
Summing these values:
Step 3: Calculate the probability
The probability is the number of favorable outcomes divided by the total number of outcomes:
Simplify the fraction by dividing the numerator and the denominator by \( 10 \):

Snap & solve any problem in the app
Get step-by-step solutions on Sovi AI
Photo-based solutions with guided steps
Explore more problems and detailed explanations
\( \frac{7}{13} \)