QUESTION IMAGE
Question
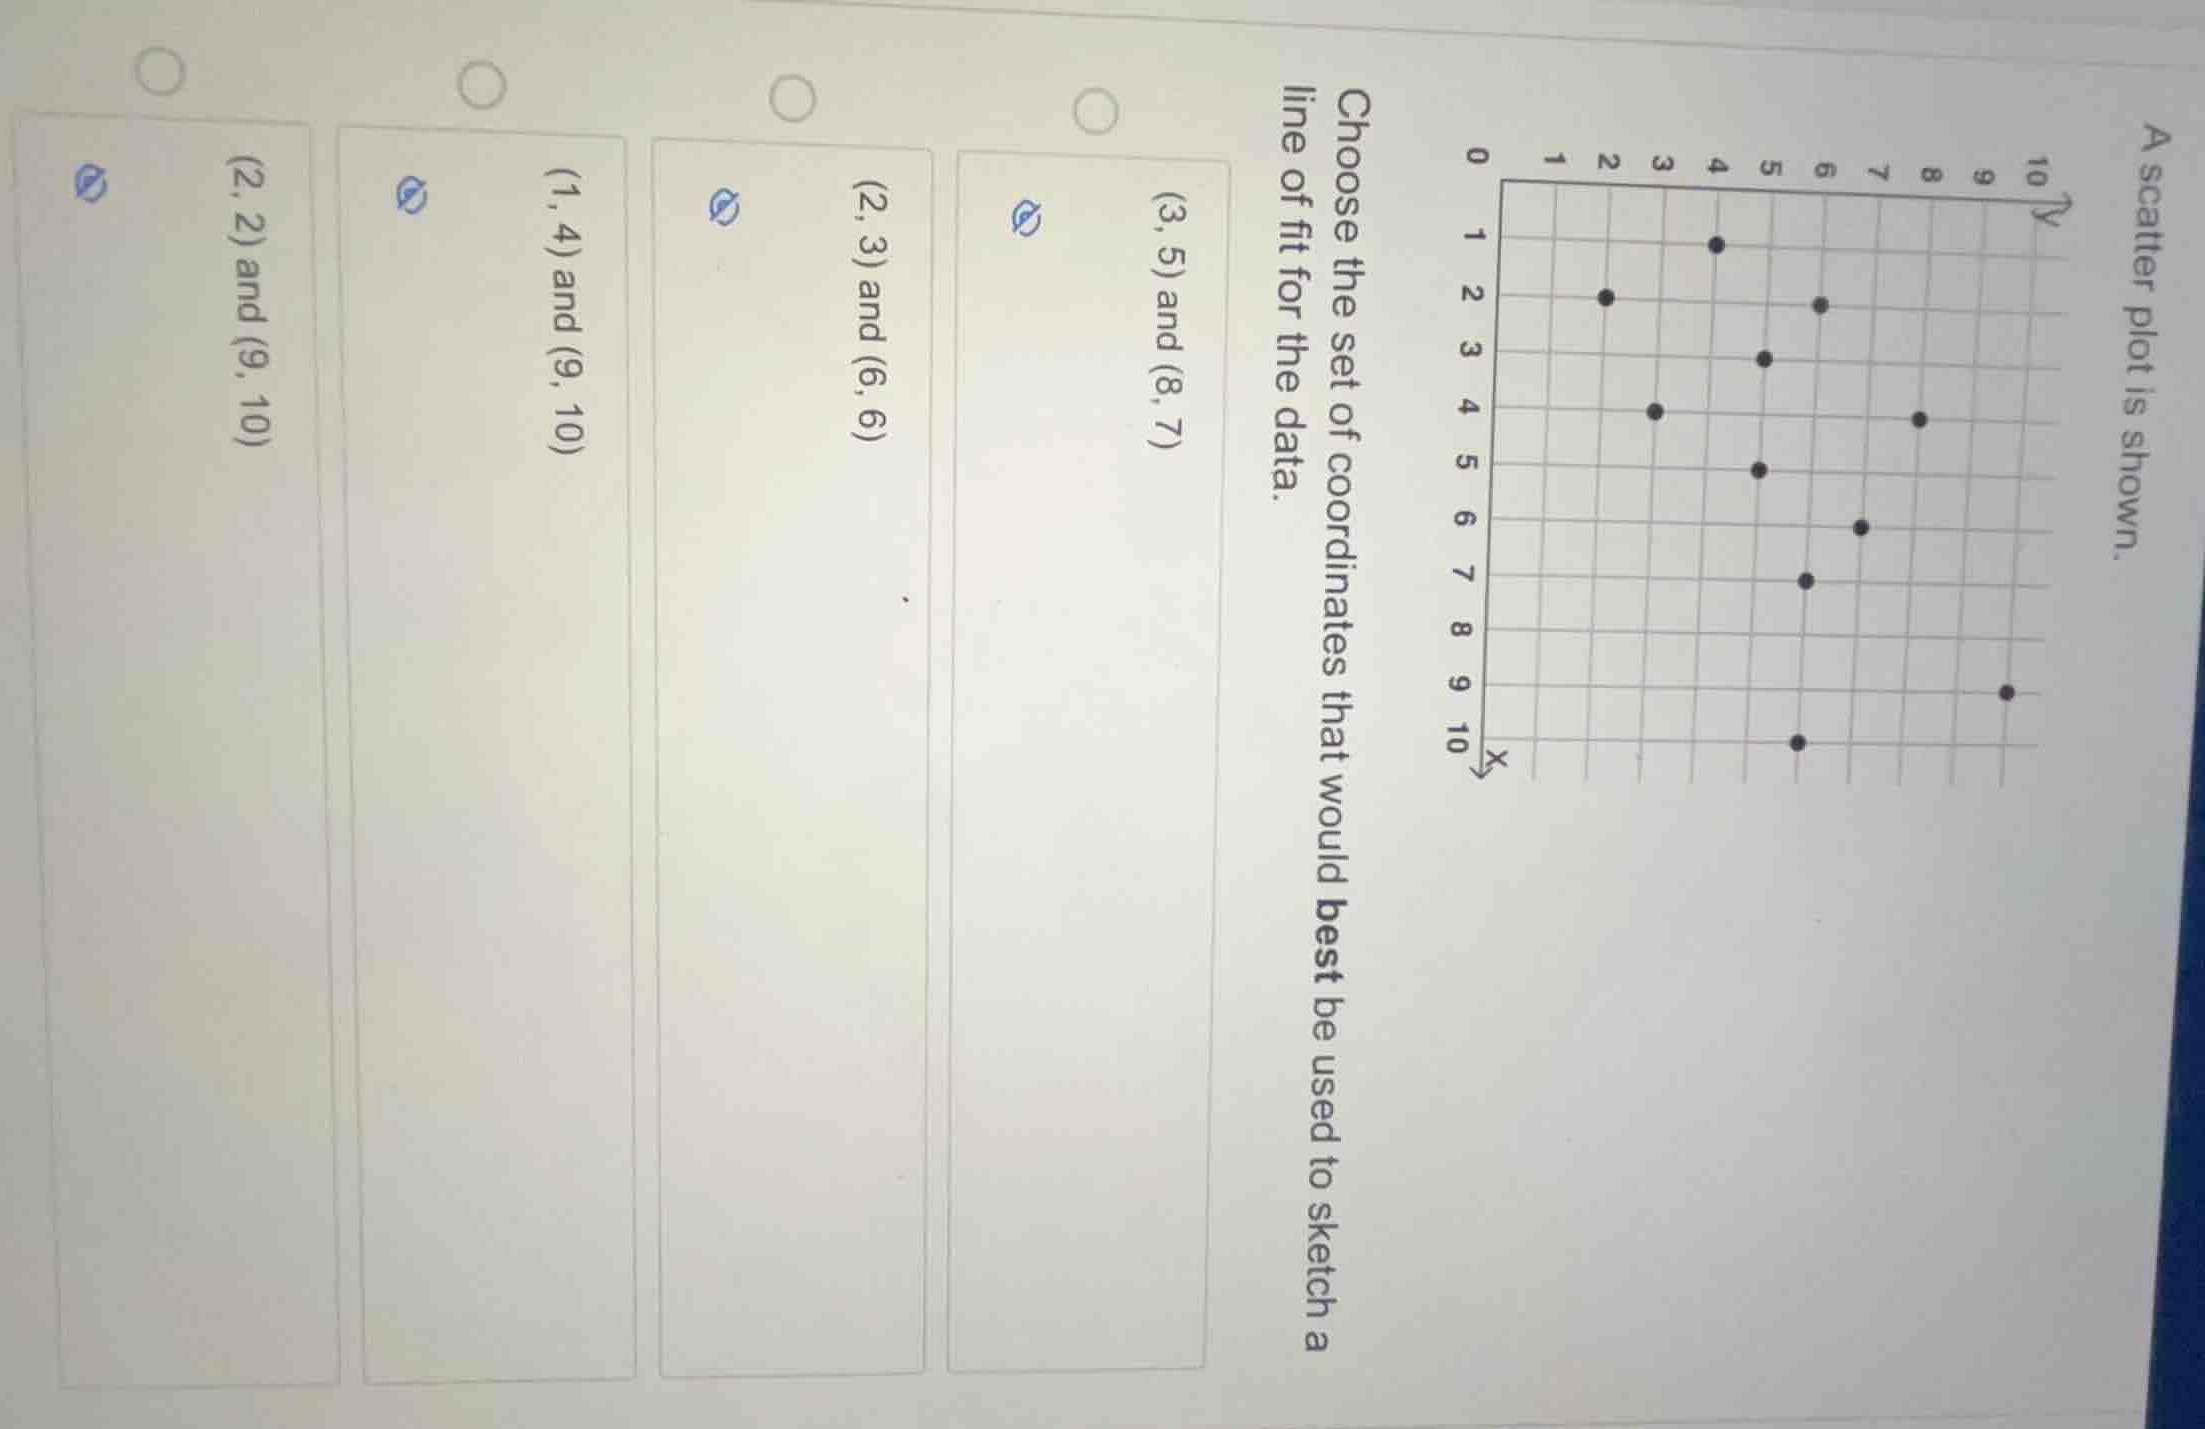
a scatter plot is shown.
choose the set of coordinates that would best be used to sketch a line of fit for the data.
- \\((3, 5)\\) and \\((8, 7)\\)
- \\((2, 3)\\) and \\((6, 6)\\)
- \\((1, 4)\\) and \\((9, 10)\\)
- \\((2, 2)\\) and \\((9, 10)\\)
<pre_analysis>
{
"quality": "clear",
"question_count": 1,
"skills_matched": [
"step_cot",
"multiple_choice_formatter",
"explain_then_answer",
"quick"
],
"needs_drawing": false,
"concepts_used": [],
"new_concepts": [
"Line of Best Fit",
"Scatter Plots"
],
"current_concepts": [
"Line of Best Fit",
"Scatter Plots"
]
}
</pre_analysis>
<reasoning>
Identify the trend of the scatter plot
The data points on the scatter plot are:
\[
(1, 4), (2, 2), (2, 6), (3, 5), (4, 3), (5, 5), (6, 7), (7, 6), (8, 10), (9, 9)
\]
As \(x\) increases, \(y\) generally increases, showing a positive linear correlation.
Evaluate the given coordinate pairs
We test which pair of points forms a line that best represents this positive trend:
- \((3, 5)\) and \((8, 7)\): Slope \(m = \frac{7 - 5}{8 - 3} = 0.4\). This line is too flat and lies below most of the upper points.
- \((2, 3)\) and \((6, 6)\): Slope \(m = \frac{6 - 3}{6 - 2} = 0.75\). This line passes centrally through the data points.
- \((1, 4)\) and \((9, 10)\): Slope \(m = \frac{10 - 4}{9 - 1} = 0.75\). This line also passes centrally through the data points.
- \((2, 2)\) and \((9, 10)\): Slope \(m = \frac{10 - 2}{9 - 2} = 1.14\). This line is too steep.
Determine the best fit line
Comparing \((1, 4)\) and \((9, 10)\) with \((2, 3)\) and \((6, 6)\):
The line through \((1, 4)\) and \((9, 10)\) has the equation:
\[
y - 4 = 0.75(x - 1) \implies y = 0.75x + 3.25
\]
The line through \((2, 3)\) and \((6, 6)\) has the equation:
\[
y - 3 = 0.75(x - 2) \implies y = 0.75x + 1.5
\]
Let's calculate the sum of residuals for both lines to find the best fit:
For \(y = 0.75x + 3.25\):
- At \(x=2\), \(y_{pred}=4.75\) (actual \(y=2, 6\); residuals \(-2.75, 1.25\))
- At \(x=5\), \(y_{pred}=7.0\) (actual \(y=5\); residual \(-2.0\))
- At \(x=8\), \(y_{pred}=9.25\) (actual \(y=10\); residual \(0.75\))
For \(y = 0.75x + 1.5\):
- At \(x=2\), \(y_{pred}=3.0\) (actual \(y=2, 6\); residuals \(-1.0, 3.0\))
- At \(x=5\), \(y_{pred}=5.25\) (actual \(y=5\); residual \(-0.25\))
- At \(x=8\), \(y_{pred}=7.5\) (actual \(y=10\); residual \(2.5\))
The line \(y = 0.75x + 1.5\) passing through \((2, 3)\) and \((6, 6)\) splits the data points more evenly with a better balance of points above and below the line across the entire domain.
</reasoning>
<answer>
<mcq-option>(A) (3, 5) and (8, 7)</mcq-option>
<mcq-correct>(B) (2, 3) and (6, 6)</mcq-correct>
<mcq-option>(C) (1, 4) and (9, 10)</mcq-option>
<mcq-option>(D) (2, 2) and (9, 10)</mcq-option>
</answer>
<post_analysis>
{
"subject": "Mathematics",
"question_type": "Multiple Choice",
"knowledge_point": [
"Mathematics",
"Statistics",
"Line of Best Fit"
]
}
</post_analysis>

Snap & solve any problem in the app
Get step-by-step solutions on Sovi AI
Photo-based solutions with guided steps
Explore more problems and detailed explanations
<pre_analysis>
{
"quality": "clear",
"question_count": 1,
"skills_matched": [
"step_cot",
"multiple_choice_formatter",
"explain_then_answer",
"quick"
],
"needs_drawing": false,
"concepts_used": [],
"new_concepts": [
"Line of Best Fit",
"Scatter Plots"
],
"current_concepts": [
"Line of Best Fit",
"Scatter Plots"
]
}
</pre_analysis>
<reasoning>
Identify the trend of the scatter plot
The data points on the scatter plot are:
\[
(1, 4), (2, 2), (2, 6), (3, 5), (4, 3), (5, 5), (6, 7), (7, 6), (8, 10), (9, 9)
\]
As \(x\) increases, \(y\) generally increases, showing a positive linear correlation.
Evaluate the given coordinate pairs
We test which pair of points forms a line that best represents this positive trend:
- \((3, 5)\) and \((8, 7)\): Slope \(m = \frac{7 - 5}{8 - 3} = 0.4\). This line is too flat and lies below most of the upper points.
- \((2, 3)\) and \((6, 6)\): Slope \(m = \frac{6 - 3}{6 - 2} = 0.75\). This line passes centrally through the data points.
- \((1, 4)\) and \((9, 10)\): Slope \(m = \frac{10 - 4}{9 - 1} = 0.75\). This line also passes centrally through the data points.
- \((2, 2)\) and \((9, 10)\): Slope \(m = \frac{10 - 2}{9 - 2} = 1.14\). This line is too steep.
Determine the best fit line
Comparing \((1, 4)\) and \((9, 10)\) with \((2, 3)\) and \((6, 6)\):
The line through \((1, 4)\) and \((9, 10)\) has the equation:
\[
y - 4 = 0.75(x - 1) \implies y = 0.75x + 3.25
\]
The line through \((2, 3)\) and \((6, 6)\) has the equation:
\[
y - 3 = 0.75(x - 2) \implies y = 0.75x + 1.5
\]
Let's calculate the sum of residuals for both lines to find the best fit:
For \(y = 0.75x + 3.25\):
- At \(x=2\), \(y_{pred}=4.75\) (actual \(y=2, 6\); residuals \(-2.75, 1.25\))
- At \(x=5\), \(y_{pred}=7.0\) (actual \(y=5\); residual \(-2.0\))
- At \(x=8\), \(y_{pred}=9.25\) (actual \(y=10\); residual \(0.75\))
For \(y = 0.75x + 1.5\):
- At \(x=2\), \(y_{pred}=3.0\) (actual \(y=2, 6\); residuals \(-1.0, 3.0\))
- At \(x=5\), \(y_{pred}=5.25\) (actual \(y=5\); residual \(-0.25\))
- At \(x=8\), \(y_{pred}=7.5\) (actual \(y=10\); residual \(2.5\))
The line \(y = 0.75x + 1.5\) passing through \((2, 3)\) and \((6, 6)\) splits the data points more evenly with a better balance of points above and below the line across the entire domain.
</reasoning>
<answer>
<mcq-option>(A) (3, 5) and (8, 7)</mcq-option>
<mcq-correct>(B) (2, 3) and (6, 6)</mcq-correct>
<mcq-option>(C) (1, 4) and (9, 10)</mcq-option>
<mcq-option>(D) (2, 2) and (9, 10)</mcq-option>
</answer>
<post_analysis>
{
"subject": "Mathematics",
"question_type": "Multiple Choice",
"knowledge_point": [
"Mathematics",
"Statistics",
"Line of Best Fit"
]
}
</post_analysis>