QUESTION IMAGE
Question
question 3
8 pts
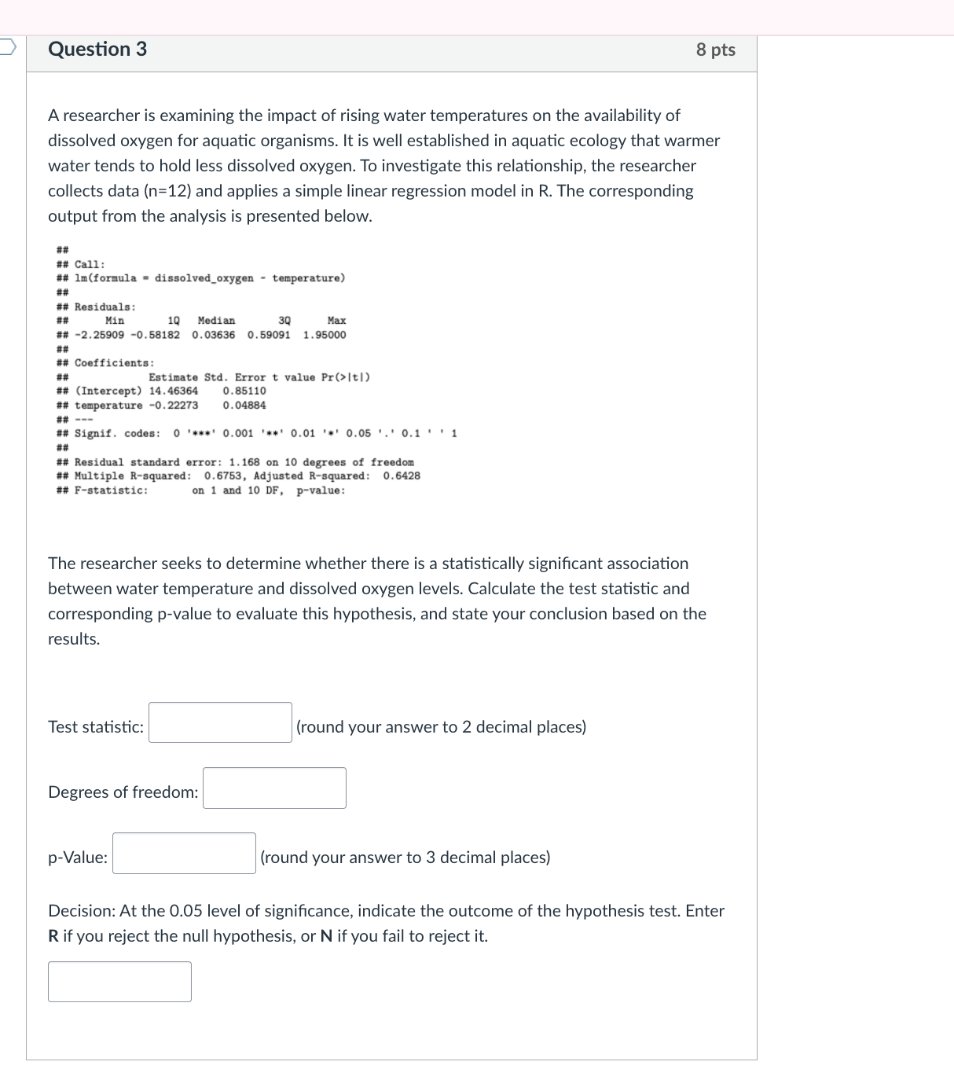
a researcher is examining the impact of rising water temperatures on the availability of dissolved oxygen for aquatic organisms. it is well established in aquatic ecology that warmer water tends to hold less dissolved oxygen. to investigate this relationship, the researcher collects data (n=12) and applies a simple linear regression model in r. the corresponding output from the analysis is presented below.
##
call:
lm(formula = dissolved_oxygen ~ temperature)
##
residuals:
min 1q median 3q max
-2.25909 -0.58182 0.03636 0.59091 1.95000
##
coefficients:
estimate std. error t value pr(>|t|)
(intercept) 14.46364 0.85110
temperature -0.22273 0.04884
---
signif. codes: 0 0.001 0.01 0.05 . 0.1 1
##
residual standard error: 1.168 on 10 degrees of freedom
multiple r-squared: 0.6753, adjusted r-squared: 0.6428
f-statistic: on 1 and 10 df, p-value:
the researcher seeks to determine whether there is a statistically significant association between water temperature and dissolved oxygen levels. calculate the test statistic and corresponding p-value to evaluate this hypothesis, and state your conclusion based on the results.
test statistic: (round your answer to 2 decimal places)
degrees of freedom:
p-value: (round your answer to 3 decimal places)
decision: at the 0.05 level of significance, indicate the outcome of the hypothesis test. enter r if you reject the null hypothesis, or n if you fail to reject it.
⚡ Using what you learned: regression, residuals, and model fit
Step 1: Calculate the Test Statistic
The test statistic \( t \) for the slope parameter (\(\beta_1\)) is calculated using the formula:
From the R output, for the predictor variable temperature:
- \(\text{Estimate} = -0.22273\)
- \(\text{Std. Error} = 0.04884\)
Rounding to 2 decimal places:
Step 2: Identify the Degrees of Freedom
For a simple linear regression with \( n \) observations and one predictor, the degrees of freedom (\( df \)) for the \( t \)-test of the slope is:
Given \( n = 12 \):
This is also directly given in the R output as "10 degrees of freedom".
Step 3: Calculate the p-Value
Using a \( t \)-distribution with \( df = 10 \), we find the two-tailed probability for \( t = -4.5604 \):
Rounding to 3 decimal places:
Step 4: Make the Decision
We compare the \( p \)-value to the significance level \(\alpha = 0.05\):
Since the \( p \)-value is less than \(\alpha\), we reject the null hypothesis (\(\text{R}\)).

Snap & solve any problem in the app
Get step-by-step solutions on Sovi AI
Photo-based solutions with guided steps
Explore more problems and detailed explanations
- Test statistic: -4.56
- Degrees of freedom: 10
- p-Value: 0.001
- Decision: R