QUESTION IMAGE
Question
part a
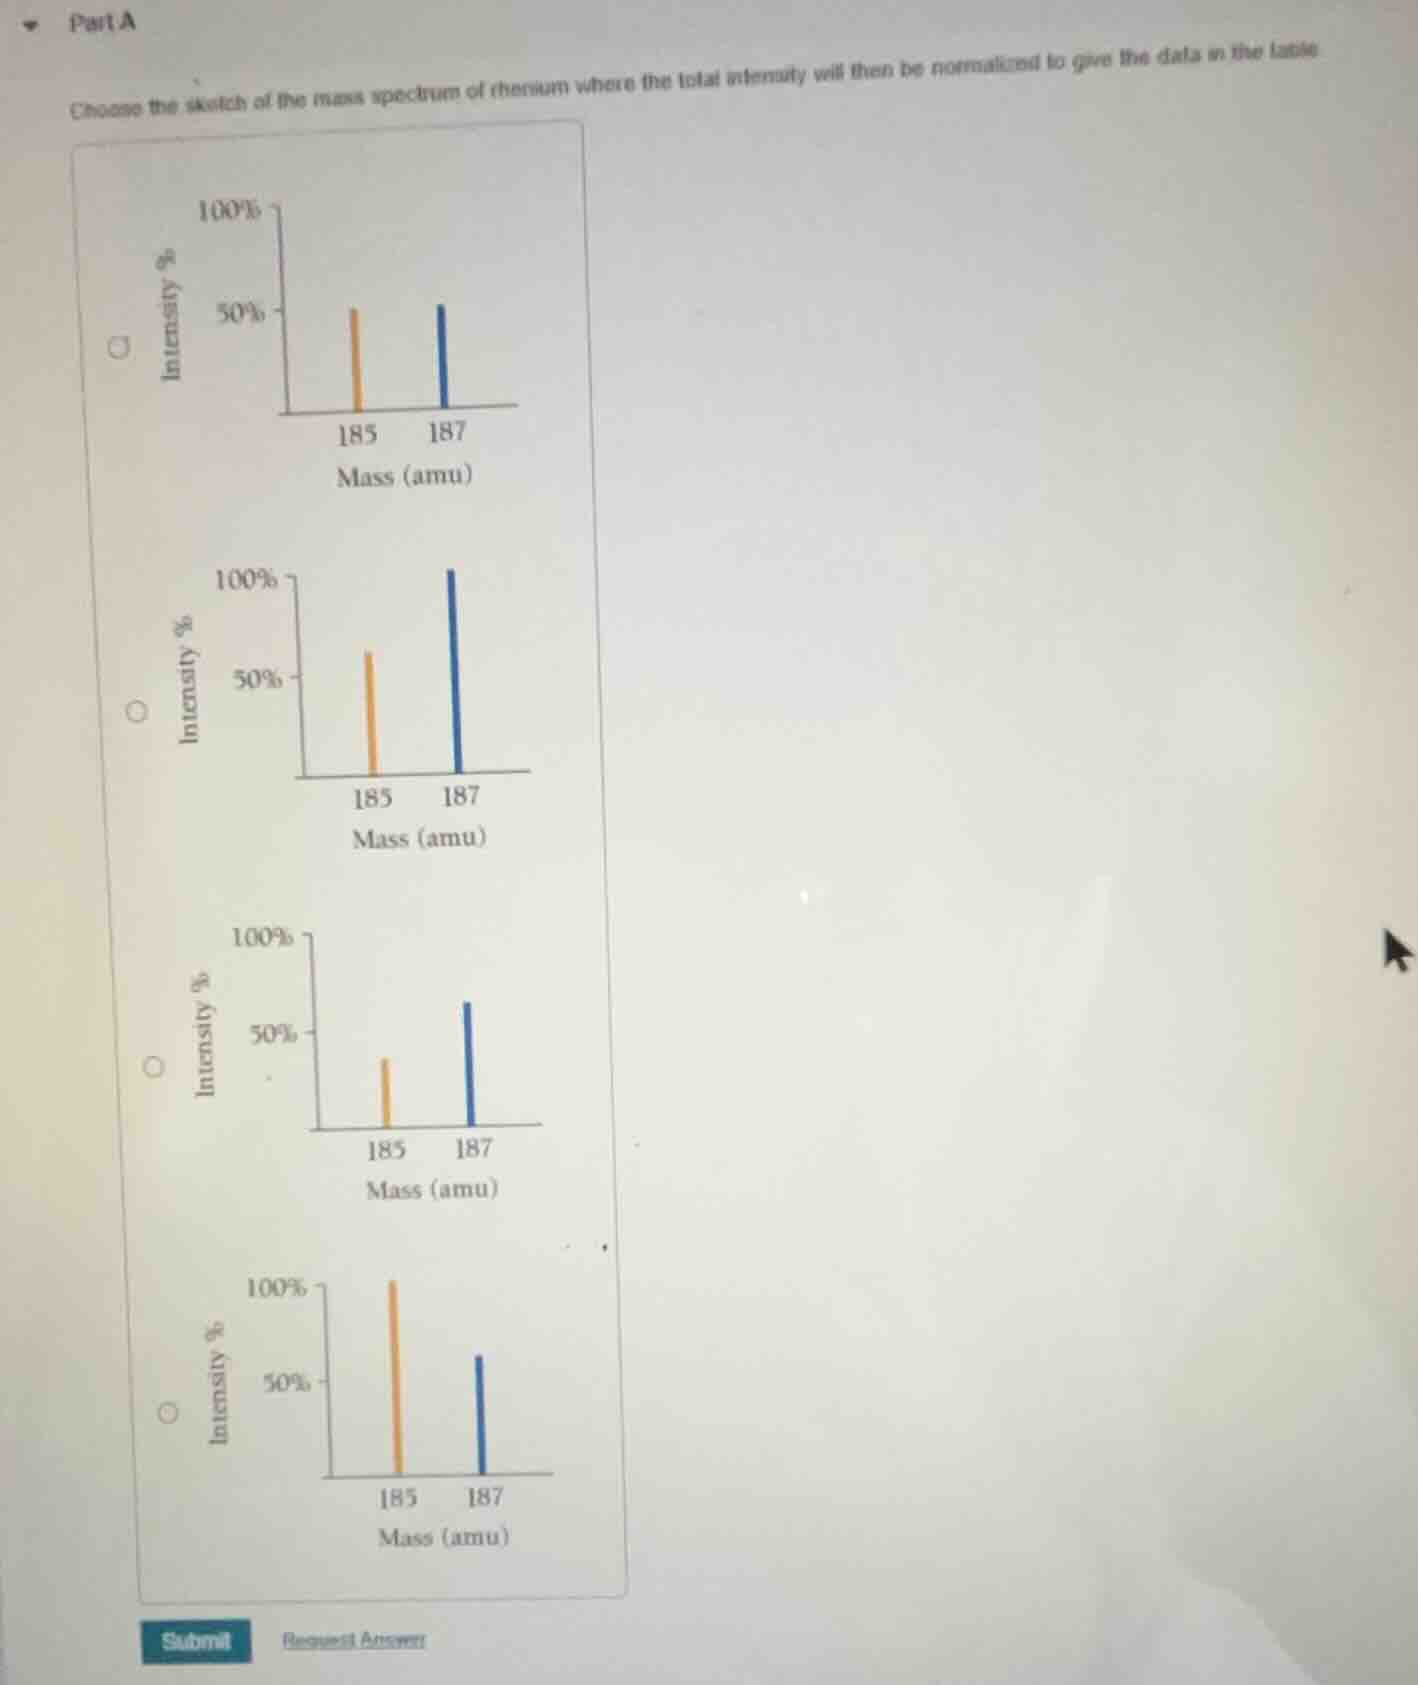
choose the sketch of the mass spectrum of rhenium where the total intensity will then be normalized to give the data in the table
To solve this, we need to recall how mass spectra for isotopes work, especially normalization. The key is the relative intensities of the isotopes of rhenium (Re has isotopes \(^{185}\text{Re}\) and \(^{187}\text{Re}\) with natural abundances: \(^{185}\text{Re}\) is about 37.4% and \(^{187}\text{Re}\) is about 62.6%). When normalized, the most abundant isotope is set to 100% intensity. So \(^{187}\text{Re}\) (more abundant) should have the 100% peak, and \(^{185}\text{Re}\) should be around \(\frac{37.4}{62.6}\approx 60\%\) of that (since 37.4/62.6 ≈ 0.6, so ~60% relative to 100% for \(^{187}\text{Re}\)).
Looking at the graphs:
- The second graph (with \(^{187}\text{Re}\) at 100% and \(^{185}\text{Re}\) at ~60% intensity) matches the relative abundances. The first graph has both ~50%, third has \(^{185}\text{Re}\) lower, fourth has \(^{185}\text{Re}\) higher (100%, \(^{187}\text{Re}\) lower) which is wrong.
Rhenium has isotopes \(^{185}\text{Re}\) (≈37.4% abundance) and \(^{187}\text{Re}\) (≈62.6% abundance). In a normalized mass spectrum, the more abundant isotope (\(^{187}\text{Re}\)) is set to 100% intensity. The \(^{185}\text{Re}\) intensity relative to \(^{187}\text{Re}\) is \(\frac{37.4}{62.6}\approx 60\%\), so the graph with \(^{187}\text{Re}\) at 100% and \(^{185}\text{Re}\) at ~60% intensity (the second graph) is correct.

Snap & solve any problem in the app
Get step-by-step solutions on Sovi AI
Photo-based solutions with guided steps
Explore more problems and detailed explanations
The second graph (with \(^{187}\text{Re}\) at 100% intensity and \(^{185}\text{Re}\) at ~60% intensity, labeled with the second radio button)