QUESTION IMAGE
Question
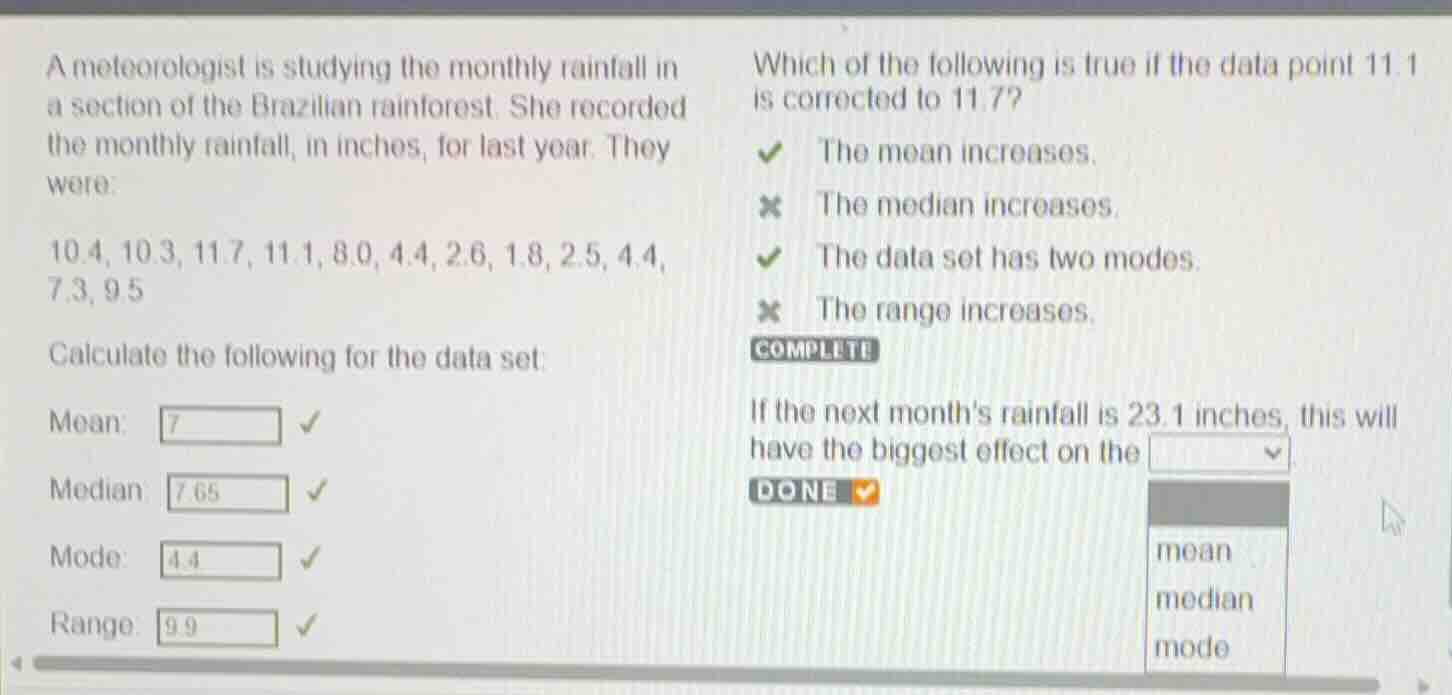
a meteorologist is studying the monthly rainfall in a section of the brazilian rainforest. she recorded the monthly rainfall, in inches, for last year. they were:
10.4, 10.3, 11.7, 11.1, 8.0, 4.4, 2.6, 1.8, 2.5, 4.4, 7.3, 9.5
calculate the following for the data set:
mean:
median:
mode:
range:
which of the following is true if the data point 11.1 is corrected to 11.7?
- the mean increases.
- the median increases.
- the data set has two modes.
- the range increases.
if the next months rainfall is 23.1 inches, this will have the biggest effect on the mean / median / mode
Analyze the original data set
The original data set consists of 12 monthly rainfall values (in inches):
Let's sort the data set in ascending order:
Using the Basic Statistics knowledge point, we verify the calculated values shown in the image:
- Mean:
- Median: Since there are 12 values, the median is the average of the 6th and 7th values:
- Mode: The value \(4.4\) appears twice, while all other values appear once. Thus, the mode is \(4.4\).
- Range:
Analyze the effect of correcting 11.1 to 11.7
If the data point \(11.1\) is corrected to \(11.7\), the new sorted data set becomes:
Let's evaluate the statements:
- The mean increases: True. The sum of the data points increases from \(84\) to \(84.6\), so the mean increases to \(\frac{84.6}{12} = 7.05\).
- The median increases: False. The 6th and 7th values remain \(7.3\) and \(8.0\), so the median remains \(7.65\).
- The data set has two modes: True. Both \(4.4\) and \(11.7\) now appear exactly twice, making the data set bimodal.
- The range increases: False. The maximum value remains \(11.7\) and the minimum remains \(1.8\), so the range remains \(9.9\).
Thus, the true statements are:
- The mean increases.
- The data set has two modes.
Analyze the effect of adding an extreme value
Using the Outlier Effects on Statistics knowledge point, we analyze the addition of a new data point of \(23.1\) inches.
- The value \(23.1\) is significantly larger than any other value in the data set (the previous maximum was \(11.7\)), making it an extreme outlier.
- Outliers have a substantial impact on the sum of the data, which directly pulls the mean toward the outlier.
- The median is a resistant measure of center; adding one data point only shifts the median position slightly to the next value in the sorted list, changing it minimally.
- The mode is completely unaffected because \(23.1\) only occurs once and does not change the frequency of the most common value.
Therefore, adding this outlier will have the biggest effect on the mean.

Snap & solve any problem in the app
Get step-by-step solutions on Sovi AI
Photo-based solutions with guided steps
Explore more problems and detailed explanations
Part 1: Calculations for the data set
- Mean: 7
- Median: 7.65
- Mode: 4.4
- Range: 9.9
Part 2: True statements if 11.1 is corrected to 11.7
- The mean increases.
- The data set has two modes.
Part 3: Effect of adding 23.1 inches
If the next month's rainfall is 23.1 inches, this will have the biggest effect on the mean.