QUESTION IMAGE
Question
Question was provided via image upload.
⚡ Using what you learned: comparing measures of center & spread
Step 1: Analyze the data set and identify outliers
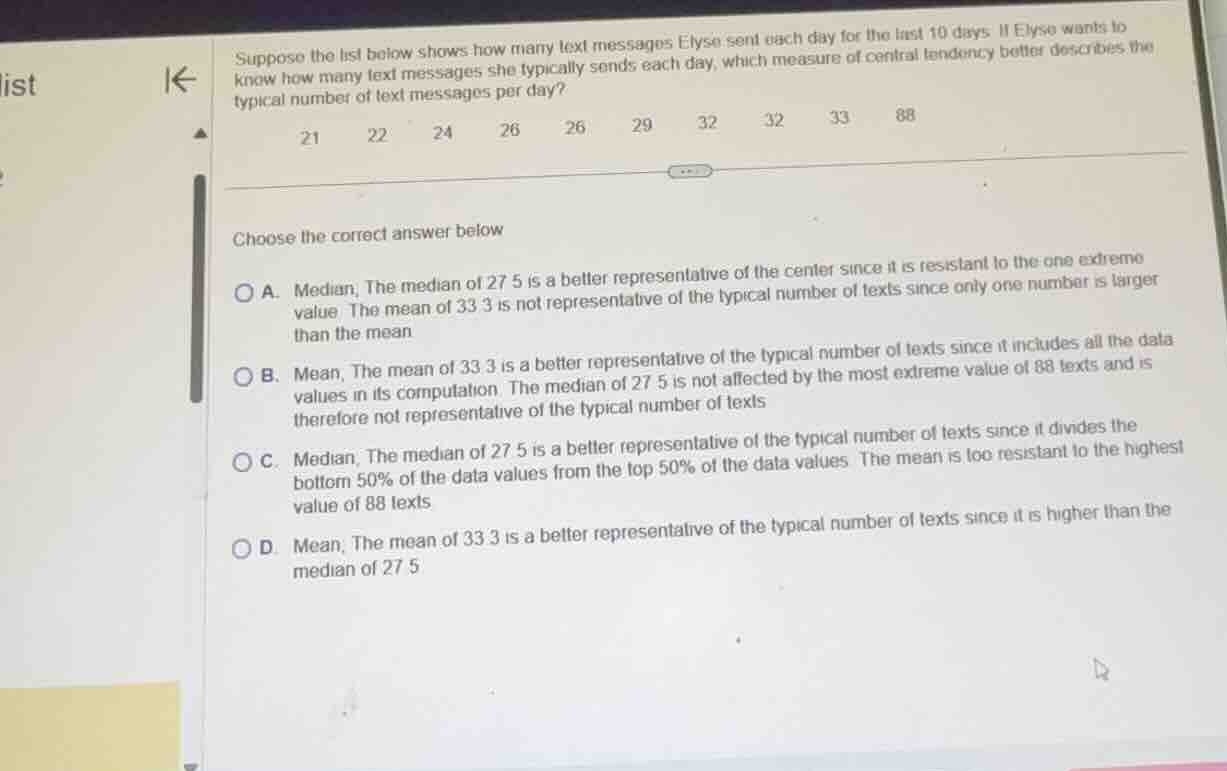
The given data set representing the number of text messages sent each day for 10 days is:
Most of the values lie closely together between \( 21 \) and \( 33 \). However, the value \( 88 \) is significantly larger than the rest of the data, making it an extreme value (outlier).
Step 2: Compare the mean and median
- Mean:
The mean of \( 33.3 \) is larger than almost all the data points (9 out of 10 values are smaller than \( 33.3 \)). This happens because the mean is highly sensitive to extreme values.
- Median:
Since there are 10 data points, the median is the average of the 5th and 6th values:
The median of \( 27.5 \) sits directly in the middle of the typical daily counts and is not pulled upward by the outlier of \( 88 \).
Step 3: Determine the best measure of central tendency
Because the data set contains a high outlier (\( 88 \)), the mean is skewed upward and does not accurately represent a "typical" day. The median is resistant to extreme values, making it the better measure of center for this skewed data set.
This matches the description in Option A:
- The median of \( 27.5 \) is a better representative because it is resistant to the one extreme value.
- The mean of \( 33.3 \) is not representative since only one data value (\( 88 \)) is larger than this mean.

Snap & solve any problem in the app
Get step-by-step solutions on Sovi AI
Photo-based solutions with guided steps
Explore more problems and detailed explanations
A. Median; The median of 27.5 is a better representative of the center since it is resistant to the one extreme value. The mean of 33.3 is not representative of the typical number of texts since only one number is larger than the mean.