QUESTION IMAGE
Question
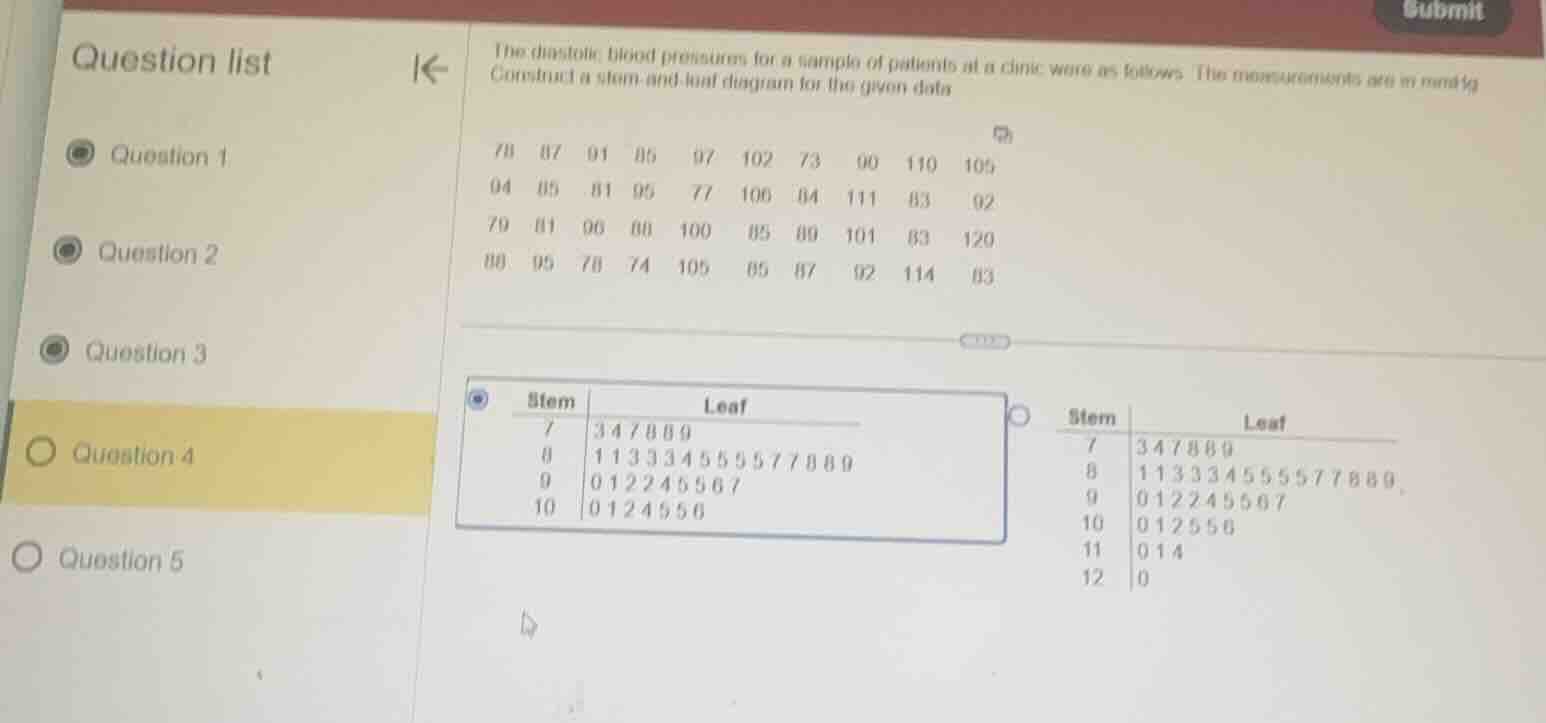
the diastolic blood pressures for a sample of patients at a clinic were as follows. the measurements are in mmhg. construct a stem-and-leaf diagram for the given data.
\\
\
\\
🆕 New Concept Discovered: Stem-and-Leaf Plots
Organizing data by splitting values into stems and leaves.
Step 1: Identify the range of the data
Find the minimum and maximum values in the dataset to determine the stems:
- Minimum value: \(73\)
- Maximum value: \(120\)
The stems will represent the tens (and hundreds) digits, ranging from \(7\) (for the \(70\)s) up to \(12\) (for the \(120\)s).
Step 2: Group and sort the data by stems
Group the data values by their leading digit(s) and list the units digit (leaves) in ascending order:
- Stem 7 (\(70\)s): \(73, 74, 77, 78, 78, 79\)
- Leaves: \(3, 4, 7, 8, 8, 9\)
- Stem 8 (\(80\)s): \(81, 81, 83, 83, 83, 84, 85, 85, 85, 85, 87, 87, 88, 89\)
- Leaves: \(1, 1, 3, 3, 3, 4, 5, 5, 5, 5, 7, 7, 8, 9\)
- Stem 9 (\(90\)s): \(90, 91, 92, 92, 94, 95, 95, 97\)
- Leaves: \(0, 1, 2, 2, 4, 5, 5, 7\)
- Stem 10 (\(100\)s): \(100, 101, 102, 105, 105, 106\)
- Leaves: \(0, 1, 2, 5, 5, 6\)
- Stem 11 (\(110\)s): \(110, 111, 114\)
- Leaves: \(0, 1, 4\)
- Stem 12 (\(120\)s): \(120\)
- Leaves: \(0\)
Step 3: Compare with the given options
- The first option only goes up to stem \(10\), omitting the values in the \(110\)s and \(120\)s (such as \(110, 111, 114, 120\)).
- The second option correctly lists all stems from \(7\) to \(12\) and includes all corresponding leaves in ordered sequence.

Snap & solve any problem in the app
Get step-by-step solutions on Sovi AI
Photo-based solutions with guided steps
Explore more problems and detailed explanations
The correct choice is the second option (on the right):
Stem | Leaf
  7  | 3 4 7 8 8 9
  8  | 1 1 3 3 3 4 5 5 5 5 7 7 8 9
  9  | 0 1 2 2 4 5 5 7
 10  | 0 1 2 5 5 6
 11  | 0 1 4
 12  | 0