QUESTION IMAGE
Question
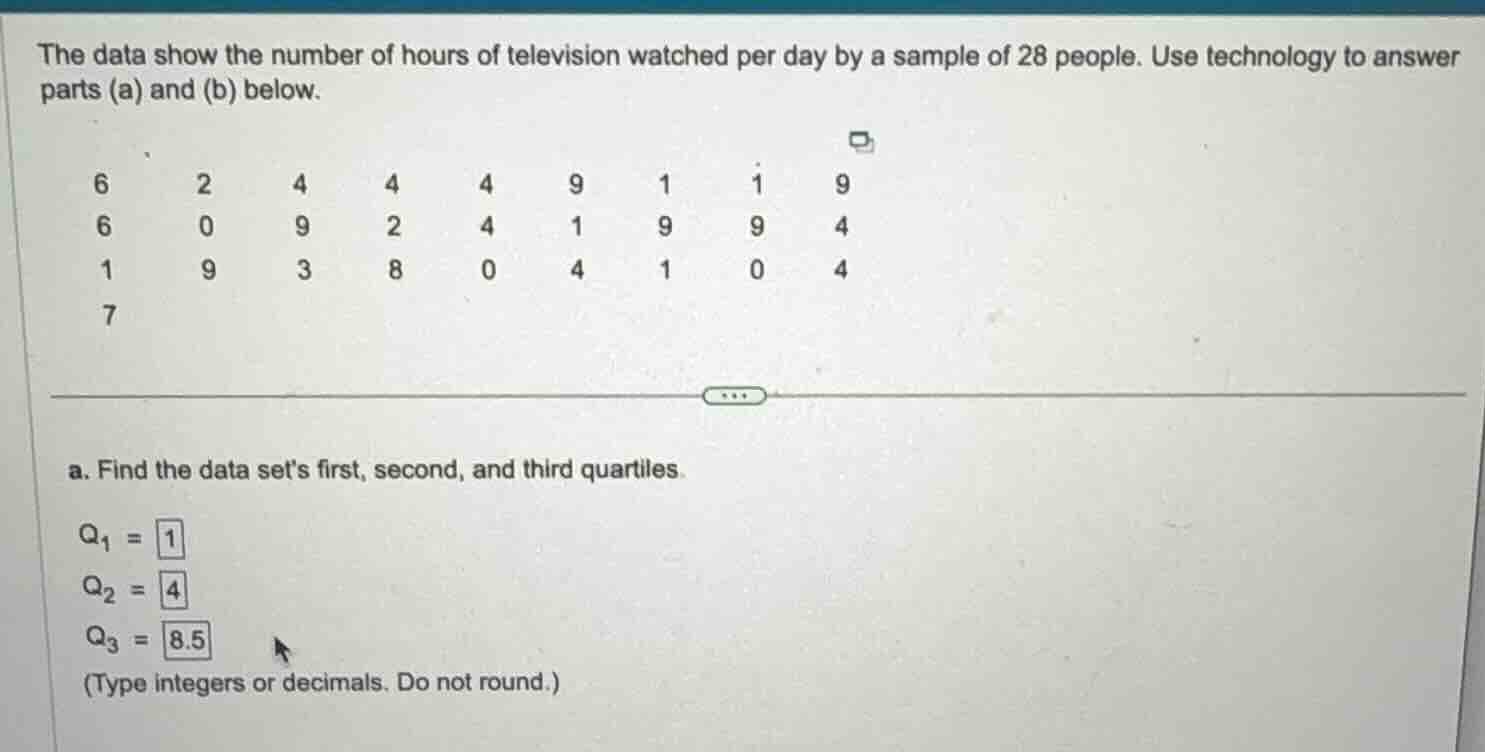
the data show the number of hours of television watched per day by a sample of 28 people. use technology to answer parts (a) and (b) below.
\
$$\begin{matrix} 6 & 2 & 4 & 4 & 4 & 9 & 1 & 1 & 9 \\\\ 6 & 0 & 9 & 2 & 4 & 1 & 9 & 9 & 4 \\\\ 1 & 9 & 3 & 8 & 0 & 4 & 1 & 0 & 4 \\\\ 7 & & & & & & & & \\end{matrix}$$
a. find the data sets first, second, and third quartiles.
\\(q_1 = 1\\)
\\(q_2 = 4\\)
\\(q_3 = 8.5\\)
(type integers or decimals. do not round.)
Sort the dataset
Using the Median Calculation and Percentiles and Quantiles knowledge points
$$
LATEXBLOCK0
$$
Calculate the second quartile (Q2)
Using the Median Calculation knowledge point
$$
LATEXBLOCK1
$$
Calculate the first quartile (Q1)
Using the Percentiles and Quantiles knowledge point
$$
LATEXBLOCK2
$$
Calculate the third quartile (Q3)
Using the Percentiles and Quantiles knowledge point
$$
LATEXBLOCK3
$$

Snap & solve any problem in the app
Get step-by-step solutions on Sovi AI
Photo-based solutions with guided steps
Explore more problems and detailed explanations
\(Q_1 = 1\)
\(Q_2 = 4\)
\(Q_3 = 8.5\)