QUESTION IMAGE
Question
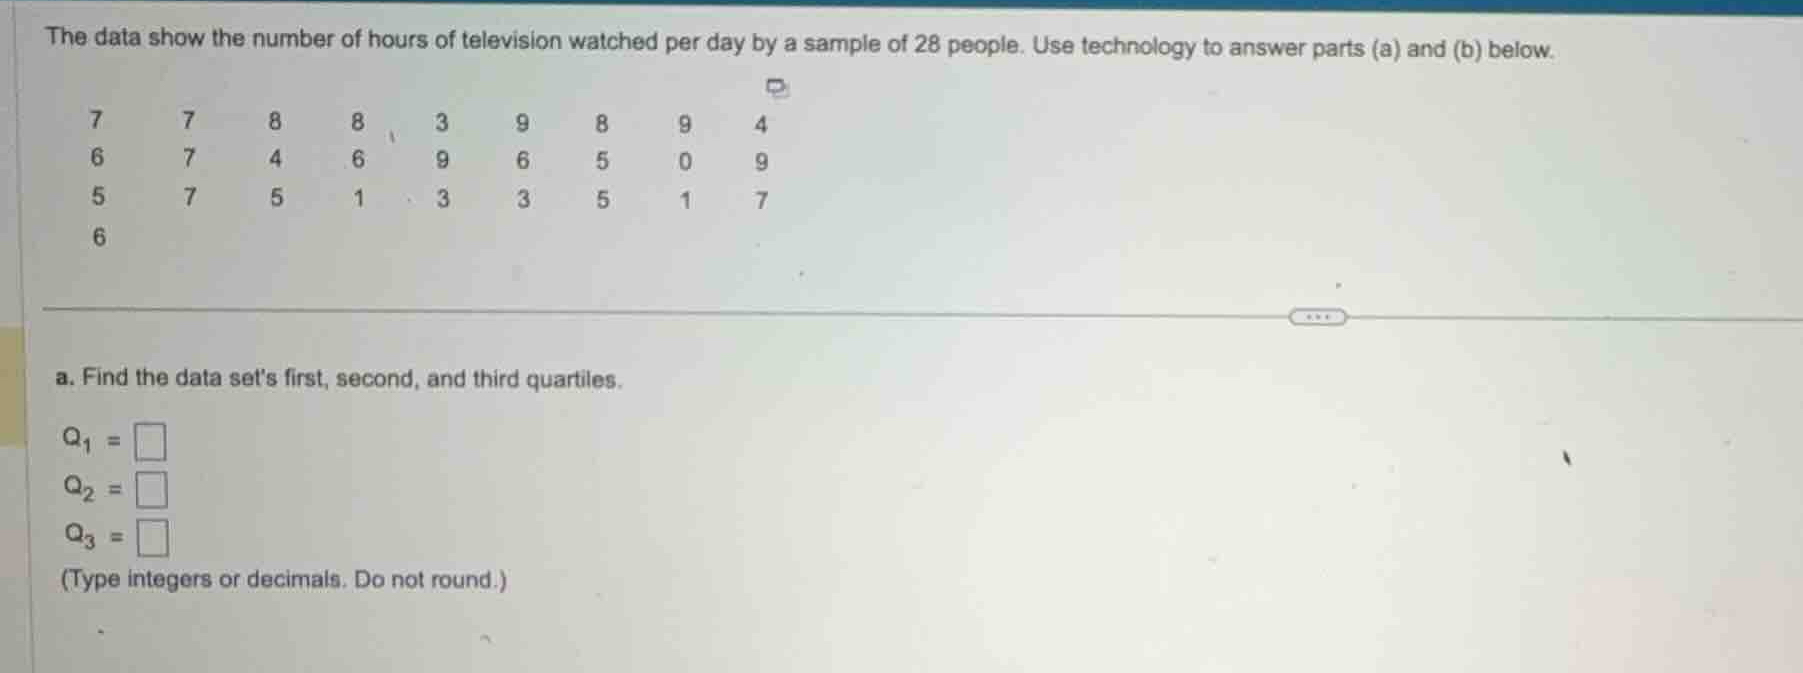
the data show the number of hours of television watched per day by a sample of 28 people. use technology to answer parts (a) and (b) below.
7 7 8 8 3 9 8 9 4
6 7 4 6 9 6 5 0 9
5 7 5 1 3 3 5 1 7
6
a. find the data sets first, second, and third quartiles.
\\(q_1 = \\)
\\(q_2 = \\)
\\(q_3 = \\)
(type integers or decimals. do not round.)
Sort the dataset
Using the Percentiles and Quantiles knowledge point
The sample size is \(n = 28\). We first arrange the 28 data values in ascending order:
Calculate the second quartile (Median, Q2)
Using the Percentiles and Quantiles knowledge point
Since \(n = 28\) is even, the median \(Q_2\) is the average of the \(14^{\text{th}}\) and \(15^{\text{th}}\) values:
Calculate the first quartile (Q1)
Using the Percentiles and Quantiles knowledge point
The lower half consists of the first 14 values:
Since there are 14 values, \(Q_1\) is the average of the \(7^{\text{th}}\) and \(8^{\text{th}}\) values of this lower half:
Calculate the third quartile (Q3)
Using the Percentiles and Quantiles knowledge point
The upper half consists of the last 14 values:
Since there are 14 values, \(Q_3\) is the average of the \(7^{\text{th}}\) and \(8^{\text{th}}\) values of this upper half:

Snap & solve any problem in the app
Get step-by-step solutions on Sovi AI
Photo-based solutions with guided steps
Explore more problems and detailed explanations
a. Find the data set's first, second, and third quartiles.
\(Q_1 =\) <blank>\(3.5\)</blank>
\(Q_2 =\) <blank>\(6\)</blank>
\(Q_3 =\) <blank>\(7\)</blank>
(Type integers or decimals. Do not round.)