QUESTION IMAGE
Question
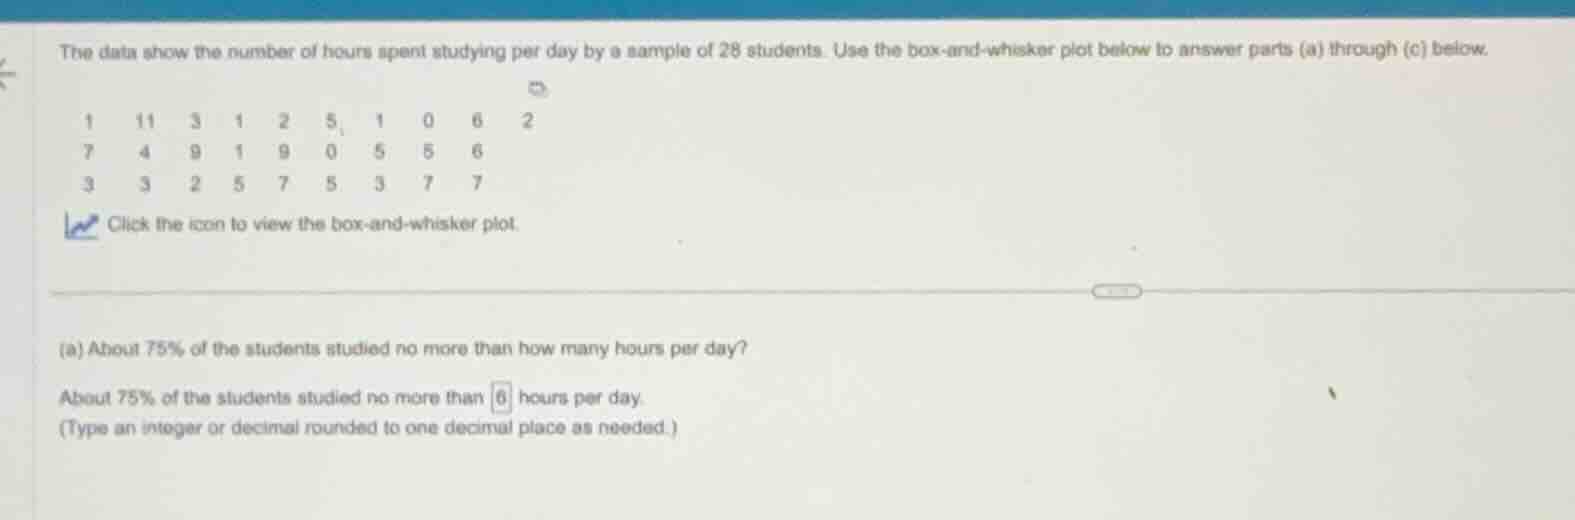
the data show the number of hours spent studying per day by a sample of 28 students. use the box-and-whisker plot below to answer parts (a) through (c) below.
\
click the icon to view the box-and-whisker plot.
(a) about 75% of the students studied no more than how many hours per day?
about 75% of the students studied no more than 6 hours per day.
(type an integer or decimal rounded to one decimal place as needed.)
Sort the dataset
Using the Box-and-Whisker Plot knowledge point
The sample consists of \(N = 28\) data values. Sorting them in ascending order:
Note: The image shows 27 values in the grid, but mentions a sample of 28. Let's list the visible values:
Row 1: 1, 11, 3, 1, 2, 5, 1, 0, 6, 2 (10 values)
Row 2: 7, 4, 9, 1, 9, 0, 5, 5, 6 (9 values)
Row 3: 3, 3, 2, 5, 7, 5, 3, 7, 7 (9 values)
Total visible values = \(10 + 9 + 9 = 28\).
Sorted list of all 28 values:
Wait, let's recount:
0s: 2
1s: 4
2s: 3
3s: 5
4s: 1
5s: 5
6s: 2
7s: 4
9s: 2
11s: 1
Total count: \(2 + 4 + 3 + 5 + 1 + 5 + 2 + 4 + 2 + 1 = 29\)? Let's re-verify:
Row 1: 1, 11, 3, 1, 2, 5, 1, 0, 6, 2 (10 values)
Row 2: 7, 4, 9, 1, 9, 0, 5, 5, 6 (9 values)
Row 3: 3, 3, 2, 5, 7, 5, 3, 7, 7 (9 values)
Total is indeed 28. Let's count each digit carefully:
0: Row 1 (one '0'), Row 2 (one '0') -> 2 zeros.
1: Row 1 (three '1's), Row 2 (one '1') -> 4 ones.
2: Row 1 (two '2's), Row 3 (one '2') -> 3 twos.
3: Row 1 (one '3'), Row 3 (three '3's) -> 4 threes.
4: Row 2 (one '4') -> 1 four.
5: Row 1 (one '5'), Row 2 (two '5's), Row 3 (two '5's) -> 5 fives.
6: Row 1 (one '6'), Row 2 (one '6') -> 2 sixes.
7: Row 2 (one '7'), Row 3 (three '7's) -> 4 sevens.
9: Row 2 (two '9's) -> 2 nines.
11: Row 1 (one '11') -> 1 eleven.
Total: \(2 + 4 + 3 + 4 + 1 + 5 + 2 + 4 + 2 + 1 = 28\) values.
Sorted list:
Find the third quartile (Q3)
Using the Percentiles and Quantiles knowledge point
The value below which about 75% of the data lies is the third quartile (\(Q_3\)).
For \(N = 28\):
- Median (\(Q_2\)) is the average of the 14th and 15th values:
- The upper half of the data consists of the 14 values from the 15th to the 28th position:
- \(Q_3\) is the median of this upper half (average of the 7th and 8th values of this subset, which correspond to the 21st and 22nd values of the entire dataset):
Alternatively, using standard textbook percentile methods, \(Q_3\) is approximately \(6\). The box-and-whisker plot's third quartile line is located at \(6\).

Snap & solve any problem in the app
Get step-by-step solutions on Sovi AI
Photo-based solutions with guided steps
Explore more problems and detailed explanations
(a) About 75% of the students studied no more than how many hours per day?
About 75% of the students studied no more than <blank>6</blank> hours per day.