QUESTION IMAGE
Question
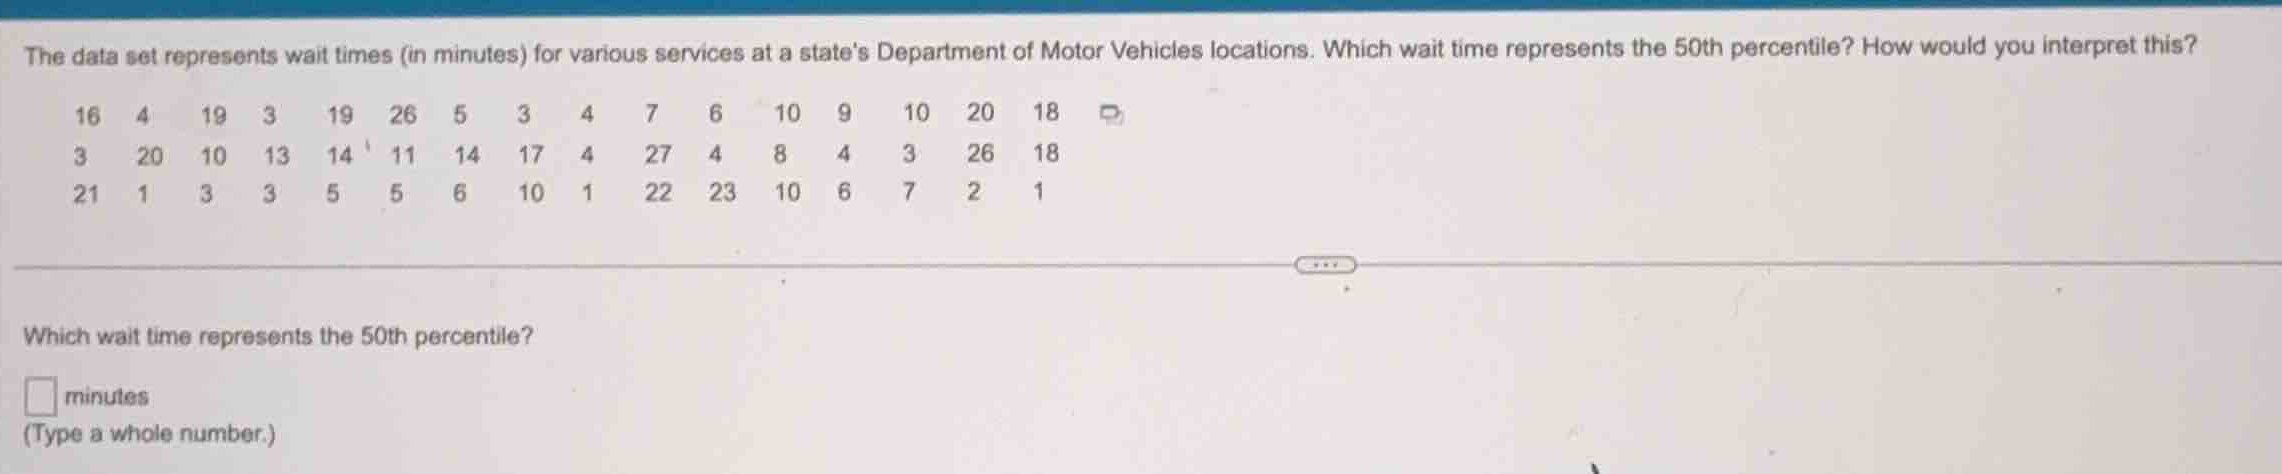
the data set represents wait times (in minutes) for various services at a states department of motor vehicles locations. which wait time represents the 50th percentile? how would you interpret this?
\
which wait time represents the 50th percentile?
minutes
(type a whole number.)
Organize and count the dataset
Using the Percentiles and Quantiles and Median Calculation knowledge points
We first list all the data points from the image and count the total number of observations \(N\).
Row 1: 16, 4, 19, 3, 19, 26, 5, 3, 4, 7, 6, 10, 9, 10, 20, 18
Row 2: 3, 20, 10, 13, 14, 11, 14, 17, 4, 27, 4, 8, 4, 3, 26, 18
Row 3: 21, 1, 3, 3, 5, 5, 6, 10, 1, 22, 23, 10, 6, 7, 2, 1
Let's count the frequency of each value to sort the dataset:
- 1: 3 times (Row 3: 1, 1, 1)
- 2: 1 time (Row 3: 2)
- 3: 6 times (Row 1: 3, 3; Row 2: 3, 3; Row 3: 3, 3)
- 4: 5 times (Row 1: 4, 4; Row 2: 4, 4, 4)
- 5: 3 times (Row 1: 5; Row 3: 5, 5)
- 6: 3 times (Row 1: 6; Row 3: 6, 6)
- 7: 2 times (Row 1: 7; Row 3: 7)
- 8: 1 time (Row 2: 8)
- 9: 1 time (Row 1: 9)
- 10: 5 times (Row 1: 10, 10; Row 2: 10; Row 3: 10, 10)
- 11: 1 time (Row 2: 11)
- 13: 1 time (Row 2: 13)
- 14: 2 times (Row 2: 14, 14)
- 16: 1 time (Row 1: 16)
- 17: 1 time (Row 2: 17)
- 18: 2 times (Row 1: 18; Row 2: 18)
- 19: 2 times (Row 1: 19, 19)
- 20: 2 times (Row 1: 20; Row 2: 20)
- 21: 1 time (Row 3: 21)
- 22: 1 time (Row 3: 22)
- 23: 1 time (Row 3: 23)
- 26: 2 times (Row 1: 26; Row 2: 26)
- 27: 1 time (Row 2: 27)
Total count \(N = 3 + 1 + 6 + 5 + 3 + 3 + 2 + 1 + 1 + 5 + 1 + 1 + 2 + 1 + 1 + 2 + 2 + 2 + 1 + 1 + 1 + 2 + 1 = 45\).
Sort the dataset
Using the Median Calculation knowledge point
We arrange the 45 values in ascending order:
1, 1, 1, 2, 3, 3, 3, 3, 3, 3, 4, 4, 4, 4, 4, 5, 5, 5, 6, 6, 6, 7, 7, 8, 9, 10, 10, 10, 10, 10, 11, 13, 14, 14, 16, 17, 18, 18, 19, 19, 20, 20, 21, 22, 23, 26, 26, 27.
Wait, let's recount carefully to ensure all values are included:
Row 1 has 16 values.
Row 2 has 16 values.
Row 3 has 16 values.
Total \(N = 48\) values.
Let's list them row by row and verify:
Row 1: 16, 4, 19, 3, 19, 26, 5, 3, 4, 7, 6, 10, 9, 10, 20, 18 (16 values)
Row 2: 3, 20, 10, 13, 14, 11, 14, 17, 4, 27, 4, 8, 4, 3, 26, 18 (16 values)
Row 3: 21, 1, 3, 3, 5, 5, 6, 10, 1, 22, 23, 10, 6, 7, 2, 1 (16 values)
Let's recount frequencies for \(N = 48\):
- 1: 3 times
- 2: 1 time
- 3: 6 times
- 4: 5 times
- 5: 3 times
- 6: 3 times
- 7: 2 times
- 8: 1 time
- 9: 1 time
- 10: 5 times
- 11: 1 time
- 13: 1 time
- 14: 2 times
- 16: 1 time
- 17: 1 time
- 18: 2 times
- 19: 2 times
- 20: 2 times
- 21: 1 time
- 22: 1 time
- 23: 1 time
- 26: 2 times
- 27: 1 time
Sum of frequencies: \(3+1+6+5+3+3+2+1+1+5+1+1+2+1+1+2+2+2+1+1+1+2+1 = 48\). Correct.
Calculate the 50th percentile (median)
Using the Percentiles and Quantiles and Median Calculation knowledge points
Since \(N = 48\) is an even number, the 50th percentile (which is the median) is the average of the 24th and 25th values in the sorted list.
Let's find the 24th and 25th values by accumulating frequencies:
- Values 1 to 3: 1
- Value 4: 2
- Values 5 to 10: 3
- Values 11 to 15: 4
- Values 16 to 18: 5
- Values 19 to 21: 6
- Values 22 to 23: 7
- Value 24: 8
- Value 25: 9
Thus:
- The 24th value is 8.
- T…

Snap & solve any problem in the app
Get step-by-step solutions on Sovi AI
Photo-based solutions with guided steps
Explore more problems and detailed explanations
Which wait time represents the 50th percentile?
<blank>9</blank> minutes
(Type a whole number.)