QUESTION IMAGE
Question
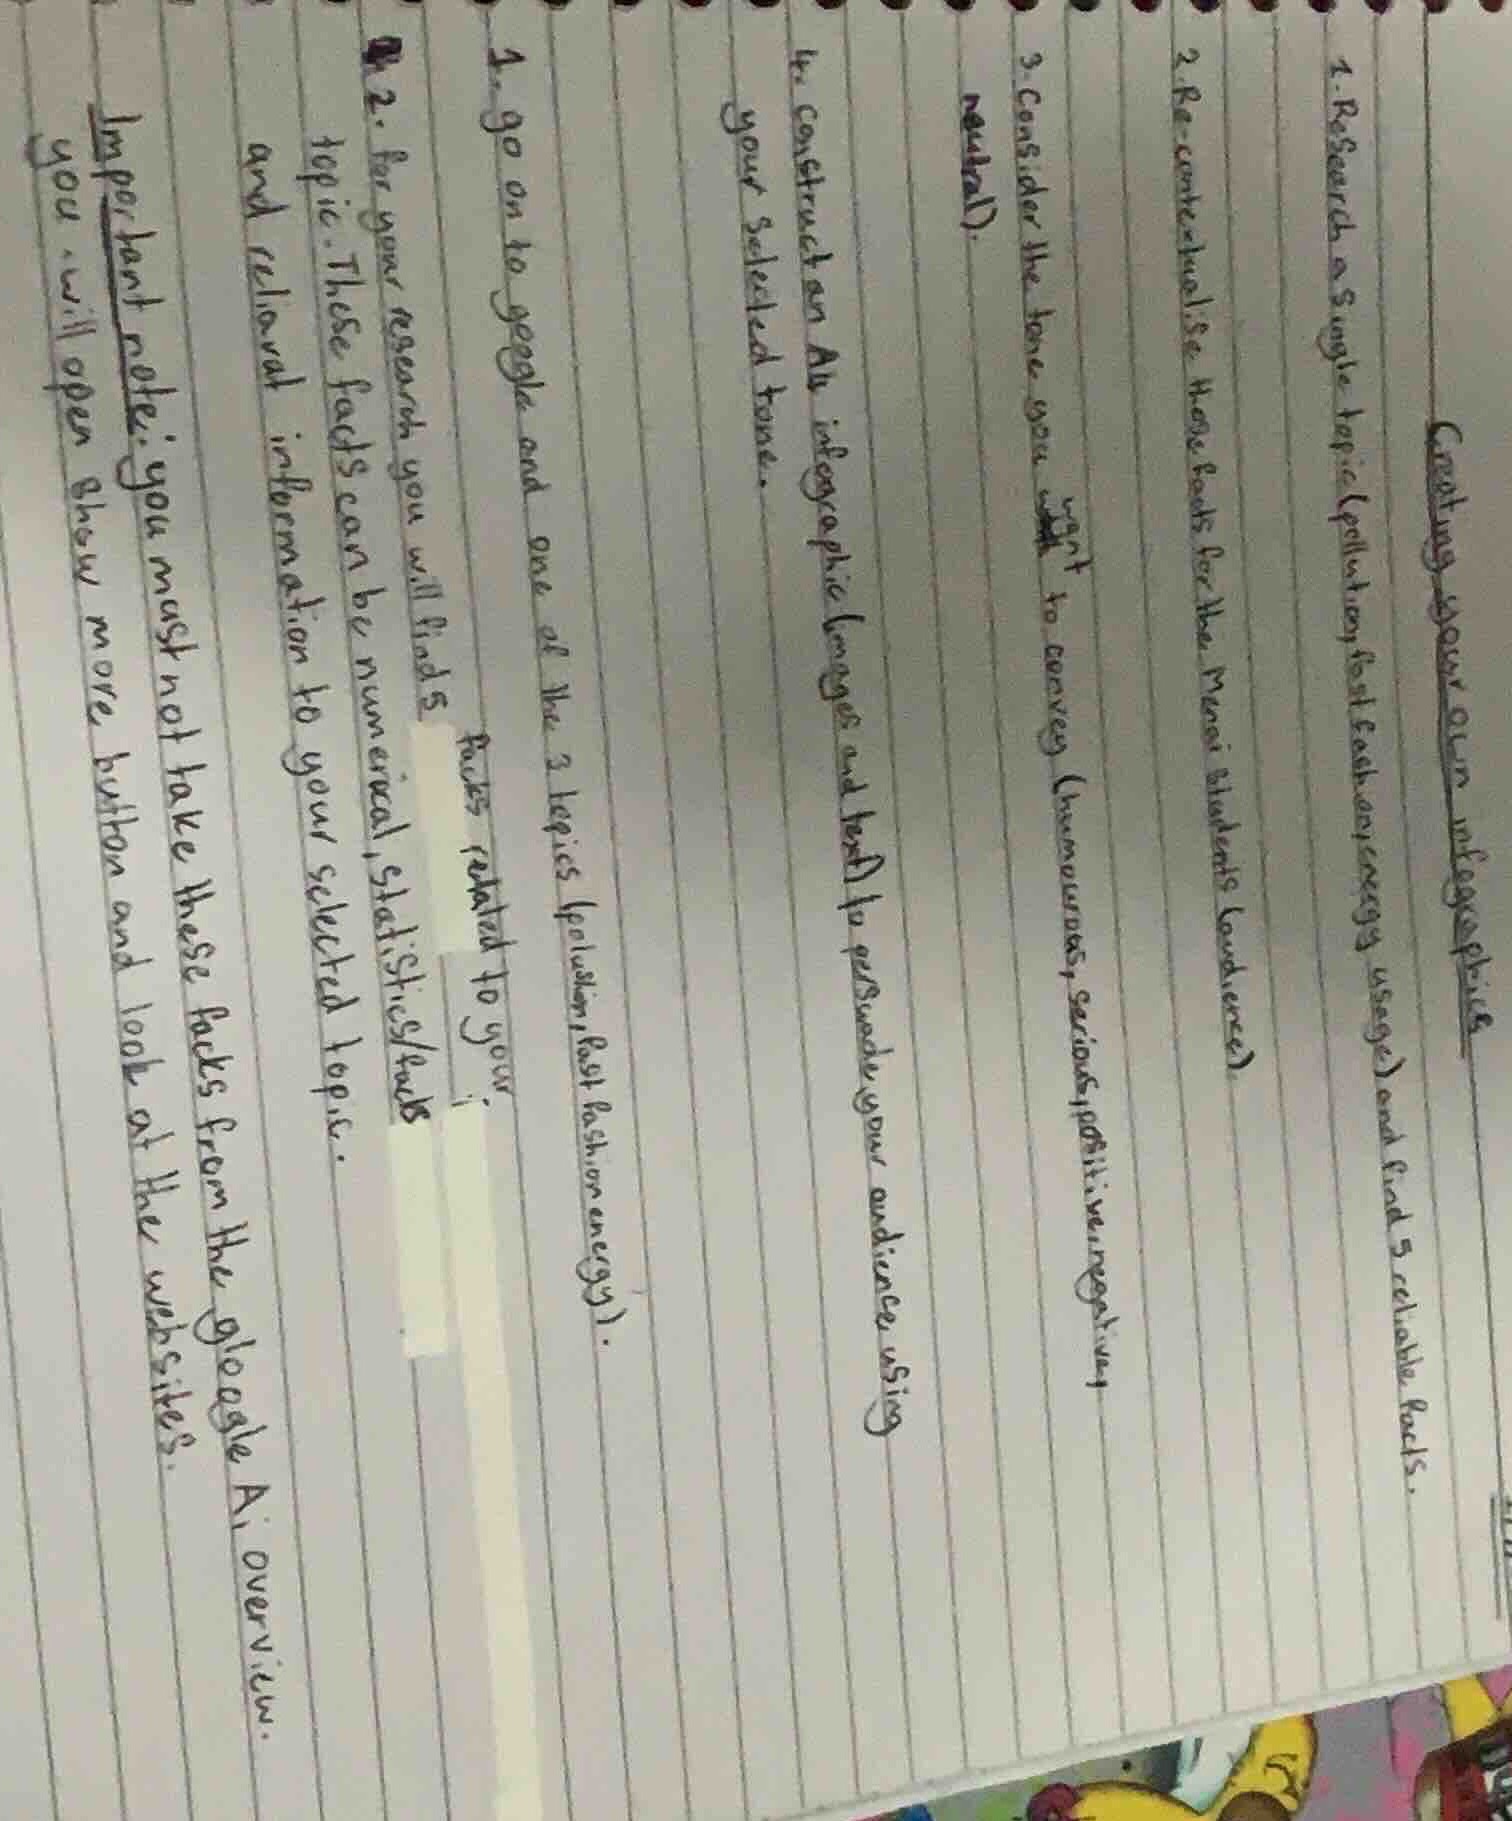
creating your own infographics
- research a single topic (pollution, fast fashion, energy usage) and find 5 reliable facts.
- re-contextualise those facts for the menai students (audience).
- consider the tone you want to convey (humourous, serious, positive, negative, neutral).
- construct an ai infographic (images and text) to persuade your audience using your selected tone.
- go on to google and one of the 3 topics (pollution, fast fashion, energy).
- for your research you will find 5 facts related to your topic. these facts can be numerical, statistics/facts and relevant information to your selected topic.
important note: you must not take these facts from the google ai overview. you will open show more button and look at the websites.
Analyze the assignment prompt
The handwritten document outlines an assignment titled "Creating your own infographic". The steps are:
- Research a single topic (pollution, fast fashion, energy usage) and find 5 reliable facts.
- Go to Google and choose one of the 3 topics.
- Find 5 facts related to your topic (numerical, statistics, facts, and relevant information).
- Important note: Do not take facts from the Google AI overview. Open websites to find them.
- Re-contextualise those facts for the Menai students (audience).
- Consider the tone you want to convey (humorous, serious, positive, negative, neutral).
- Construct an A4 infographic (images and text) to persuade your audience using your selected tone.
Using the Audience Positioning and Infographic Design knowledge points, we will structure a complete, actionable guide for an A4 infographic on "Fast Fashion" tailored specifically to Menai students.
Select tone and re-contextualise facts
To persuade high school students at Menai, we will adopt a serious yet relatable tone. Let's establish 5 realistic, high-quality facts about fast fashion and re-contextualise them to directly connect with a student's daily life, shopping habits, and local environment.
Using the Audience Positioning knowledge point:
- Fact 1 (Water consumption): It takes 2,700 liters of water to make one cotton t-shirt.
- Re-contextualisation: That is enough drinking water for one Menai student for 3 full years.
- Fact 2 (Waste/Landfill): The average person throws away 37kg of textiles annually.
- Re-contextualisation: If every student at Menai High did this, our collective clothing waste would pile higher than the school gym every single year.
- Fact 3 (Microplastics): Synthetic clothes shed microfibers when washed, polluting waterways.
- Re-contextualisation: Washing polyester uniforms releases microplastics that flow directly into our local Georges River.
- Fact 4 (Wear frequency): Many fast fashion items are worn only 7 to 10 times before being discarded.
- Re-contextualisation: Buying a cheap outfit for a single school social or weekend party contributes directly to this cycle.
- Fact 5 (Carbon footprint): The fashion industry produces 10% of global carbon emissions.
- Re-contextualisation: This is more than all international flights and maritime shipping combined—meaning our wardrobe choices impact global warming more than our travel.
Design the visual layout
Using the Visual Rhetoric and Infographic Design knowledge points, we will map out a clear, balanced visual hierarchy for a single A4 page.
An effective A4 layout uses a three-part vertical flow:
- Header (Top 20%): Bold, catchy title and a brief hook to grab the attention of students walking past a school noticeboard.
- Body (Middle 60%): A balanced 2-column grid or a vertical timeline of facts. We will use a 2-column layout to present our 5 re-contextualised facts alongside simple, high-impact visual icons.
- Footer / Call to Action (Bottom 20%): A clear, empowering "What you…

Snap & solve any problem in the app
Get step-by-step solutions on Sovi AI
Photo-based solutions with guided steps
Explore more problems and detailed explanations
Here is a complete, step-by-step blueprint to write, arrange, and design your A4 infographic on Fast Fashion tailored specifically for the Menai students audience.
---
1. Selected Tone & Audience Strategy
- Target Audience: Menai High School students.
- Selected Tone: Serious yet relatable. It avoids sounding overly preachy while using local comparisons (like the Georges River or school landmarks) to make global statistics feel personally relevant.
---
2. The 5 Re-contextualised Facts
These facts translate massive global data into concepts that a high school student can easily visualize:
- The Water Cost
- Global Fact: It takes 2,700 liters of water to manufacture a single cotton t-shirt.
- Re-contextualised for Menai: "That cheap t-shirt in your closet used 2,700L of water to make—enough drinking water to last one Menai student for 3 whole years."
- The Landfill Pile
- Global Fact: The average consumer discards roughly 37kg of clothing and textiles every year.
- Re-contextualised for Menai: "If every student at Menai High throws away the average 37kg of clothes this year, our school's collective textile waste would weigh more than 15 school buses."
- Local Waterways & Microplastics
- Global Fact: Washing synthetic textiles releases microfibers that account for 35% of primary microplastics in our oceans.
- Re-contextualised for Menai: "Every time you wash cheap polyester clothes, thousands of microplastics wash down the drain, flowing directly into our local Georges River."
- The "Wear-Once" Culture
- Global Fact: Globally, clothing lifetime has decreased by 36%, with many items worn only 7 to 10 times before disposal.
- Re-contextualised for Menai: "Buying a cheap outfit just for one weekend party or school social and never wearing it again directly fuels global landfill waste."
- The Carbon Footprint
- Global Fact: The fashion industry is responsible for 10% of global carbon emissions.
- Re-contextualised for Menai: "Our collective wardrobe choices emit more carbon than all international flights and shipping combined. Changing how we shop is the fastest way to shrink our carbon footprint."
---
3. A4 Page Layout & Visual Blueprint
To arrange this beautifully on your A4 page, follow this structural layout:
+-------------------------------------------------------------+
|                         [ HEADER ]                          |
|  TITLE: "THE REAL COST OF YOUR OUTFIT"                      |
|  Subtitle: What Menai Students Need to Know About Fast Fashion |
+-------------------------------------------------------------+
|                                                             |
|  [COLUMN 1: THE IMPACTS]       [COLUMN 2: THE NUMBERS]      |
|                                                             |
|  Fact 1: Water Consumption     Fact 3: Georges River        |
|  * Icon: Water droplet dripping  * Icon: Fish / River wave  |
|    into a t-shirt outline.       * Text: Microplastics from |
|                                    synthetic uniforms.      |
|  Fact 2: Textile Waste                                      |
|  * Icon: A giant pile of       Fact 4: Wear-Once Culture    |
|    clothes next to a bus.      * Icon: Calendar with only   |
|                                  7 days crossed out.        |
|                                                             |
|                  Fact 5: Carbon Footprint                   |
|                  * Icon: Factory chimney / Earth            |
|                                                             |
+-------------------------------------------------------------+
|                     [ CALL TO ACTION ]                      |
|  "What Can Menai Students Do?"                              |
|  1. Host a clothes swap at school.                          |
|  2. Buy second-hand or thrift.                              |
|  3. Choose natural fibers (cotton, wool) over polyester.    |
|                                                             |
|  Sources: [List your 2-3 reliable website URLs here]        |
+-------------------------------------------------------------+
4. Visual Design Tips
- Color Palette: Use a high-contrast, clean palette. For example, a neutral light background with Vibrant Purple for key statistics and Coral Orange for call-to-action highlights.
- Typography: Use a bold, clean sans-serif font for your headers (e.g., Arial Black or Impact) and a highly readable font for the body text.
- Hierarchy: Make the re-contextualised numbers (e.g., "3 YEARS", "15 BUSES") twice as large as the surrounding text so they immediately catch the eye.