QUESTION IMAGE
Question
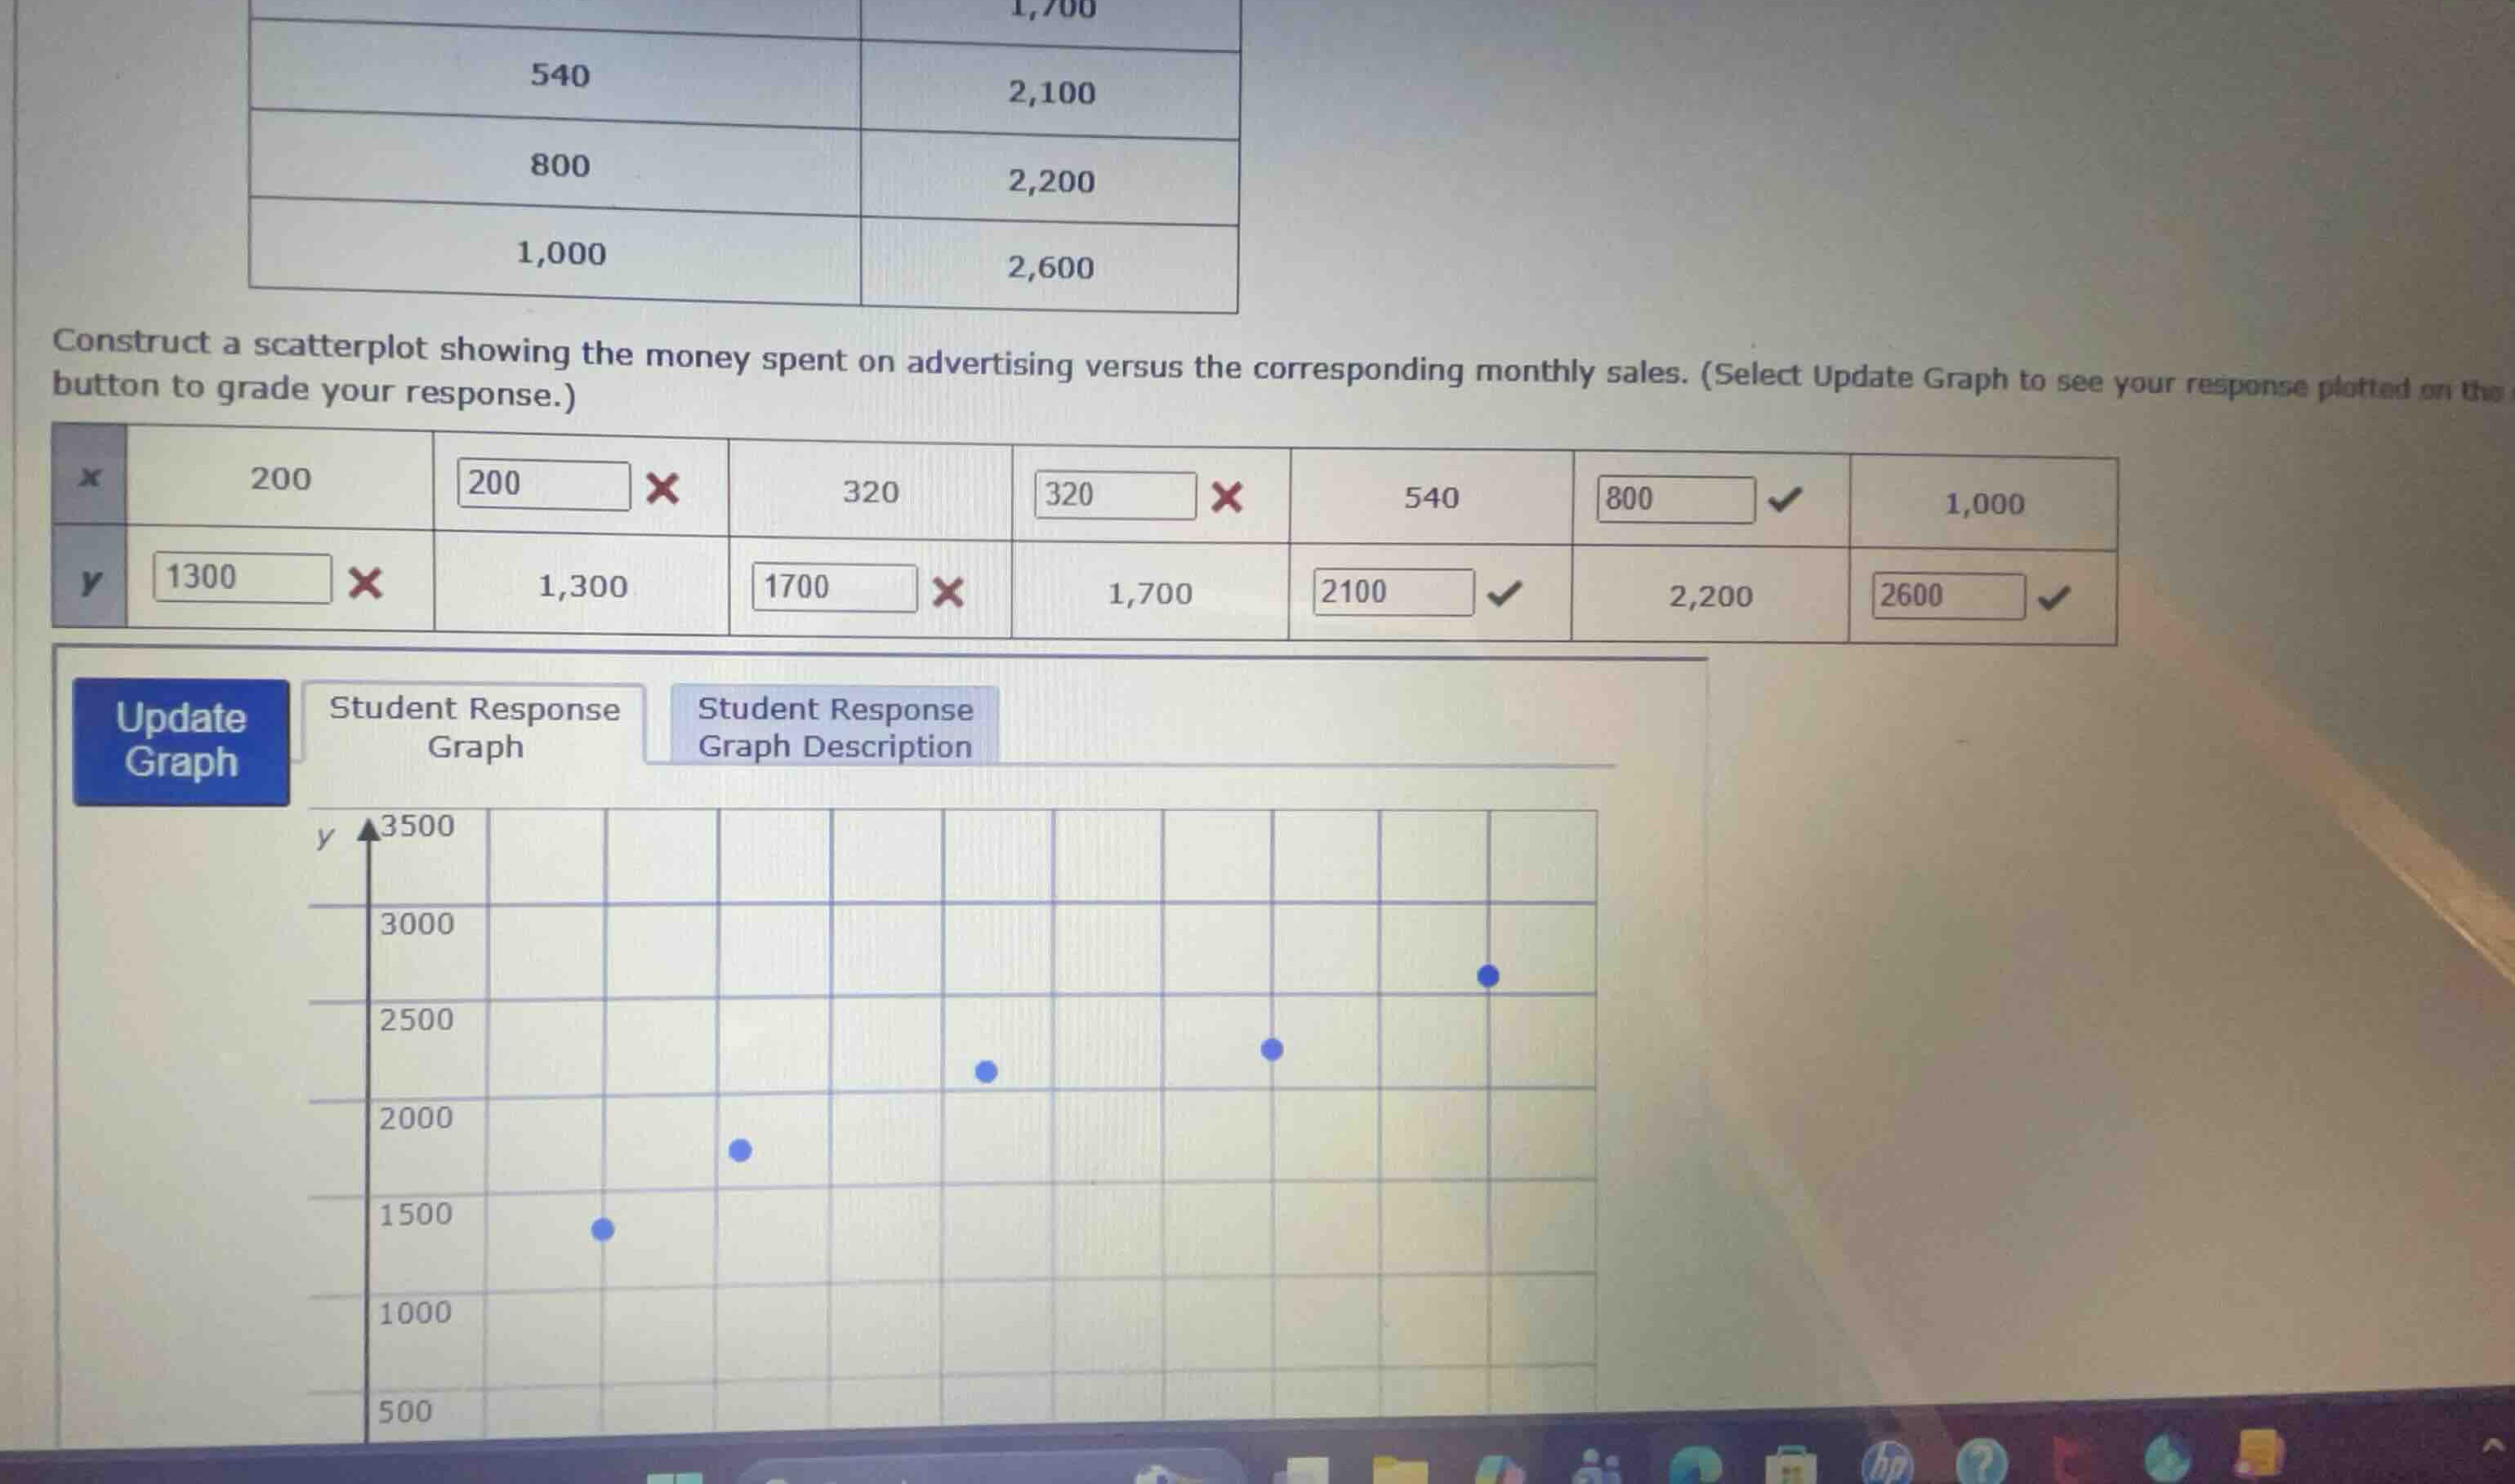
construct a scatterplot showing the money spent on advertising versus the corresponding monthly sales. (select update graph to see your response plotted on the graph.)
Identify the correct data pairs
Using the Data Pair Matching knowledge point
$$
LATEXBLOCK0
$$
Determine the correct table inputs
Using the Scatterplot Construction knowledge point
$$
LATEXBLOCK1
$$

Snap & solve any problem in the app
Get step-by-step solutions on Sovi AI
Photo-based solutions with guided steps
Explore more problems and detailed explanations
Based on the data table, the correct values to fill in the scatterplot data entry fields are:
- First column: \(y =\) <blank>1,300</blank>
- Second column: \(x =\) <blank>200</blank>
- Third column: \(y =\) <blank>1,700</blank>
- Fourth column: \(x =\) <blank>320</blank>
- Fifth column: \(y =\) <blank>2,100</blank>
- Sixth column: \(x =\) <blank>800</blank>
- Seventh column: \(y =\) <blank>2,600</blank>