QUESTION IMAGE
Question
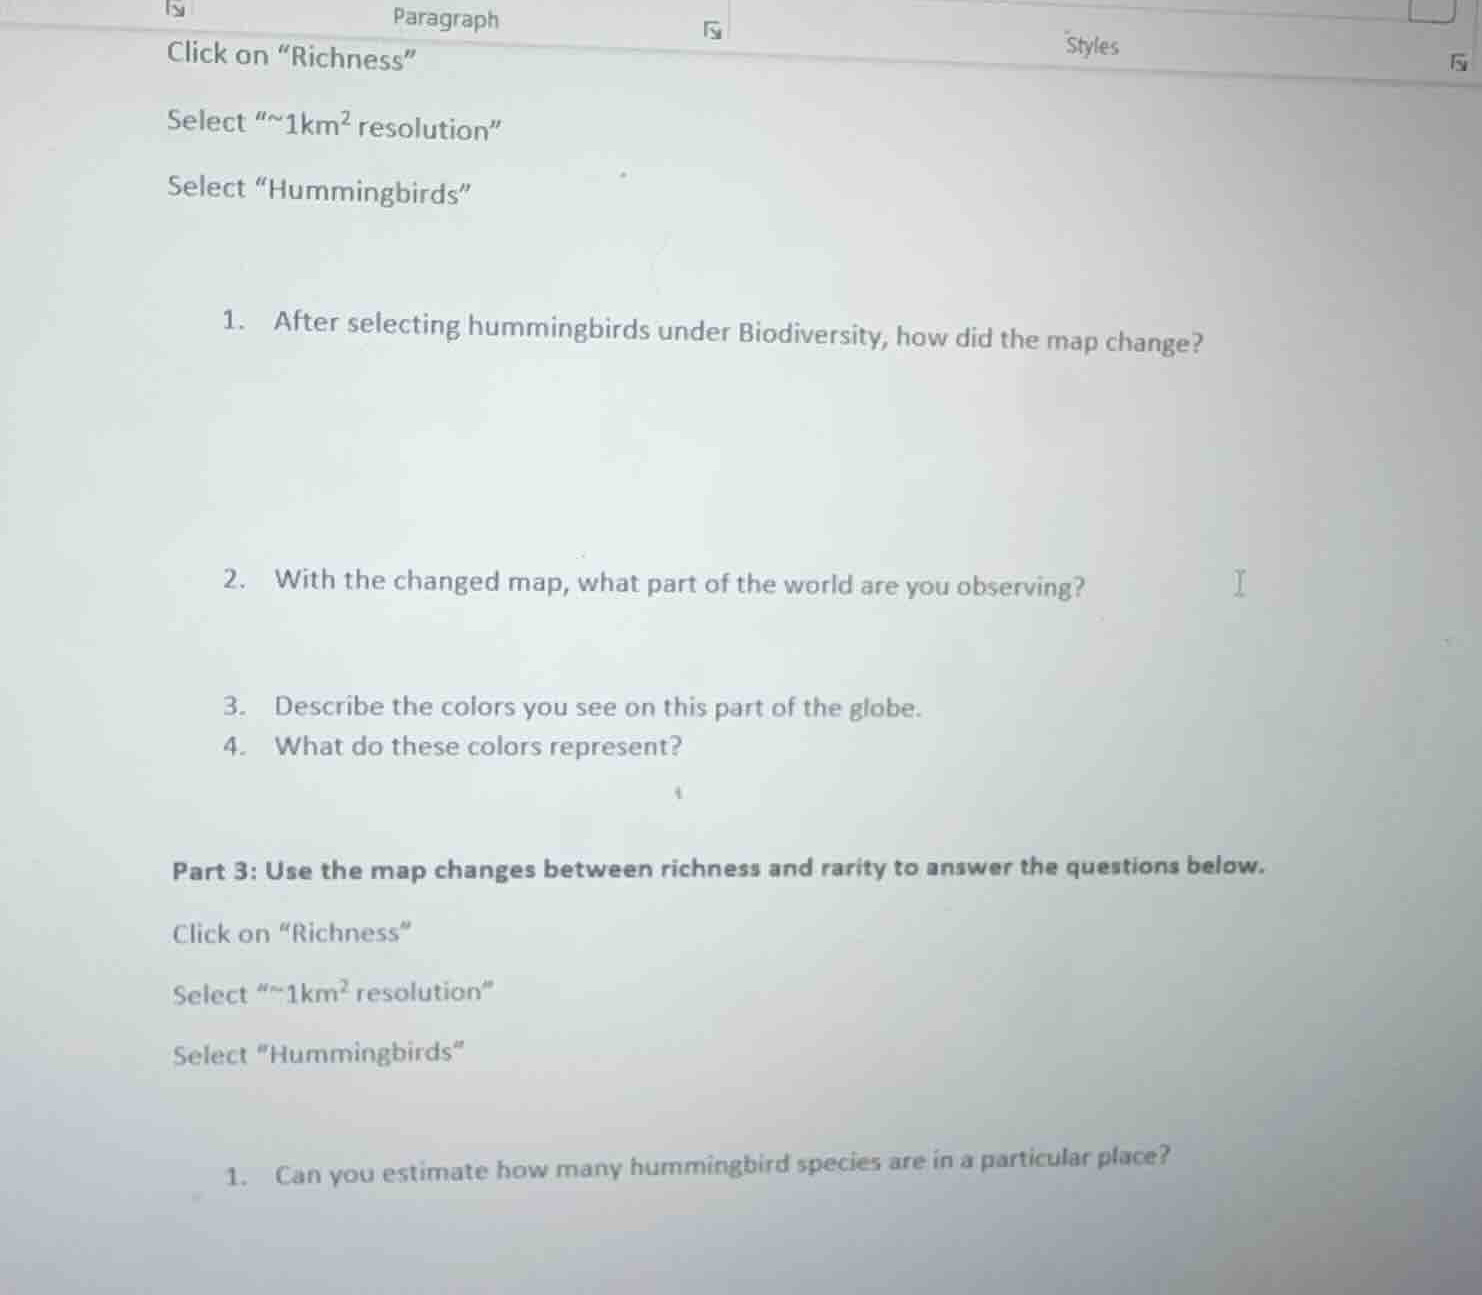
click on
ichness\
select \~1km² resolution\
select \hummingbirds\
- after selecting hummingbirds under biodiversity, how did the map change?
- with the changed map, what part of the world are you observing?
- describe the colors you see on this part of the globe.
- what do these colors represent?
part 3: use the map changes between richness and rarity to answer the questions below.
click on
ichness\
select \~1km² resolution\
select \hummingbirds\
- can you estimate how many hummingbird species are in a particular place?
<pre_analysis>
{
"quality": "clear",
"question_count": 5,
"skills_matched": [
"direct_cot",
"explain_then_answer",
"tutor"
],
"needs_drawing": false,
"concepts_used": [
"Half-Earth Project",
"Biodiversity Mapping",
"Heat Map Interpretation"
],
"new_concepts": [
"Species Richness Mapping",
"Hummingbird Distribution"
],
"current_concepts": [
"Half-Earth Project",
"Biodiversity Mapping",
"Heat Map Interpretation",
"Species Richness Mapping",
"Hummingbird Distribution"
]
}
</pre_analysis>
<reasoning>
Identify the interactive mapping context
The questions refer to an interactive GIS mapping tool, specifically the Half-Earth Project Map. The user is instructed to select "Richness", set the resolution to "~1km² resolution", and select "Hummingbirds" under the Biodiversity layers.
Analyze map changes for hummingbirds
When selecting "Hummingbirds" under species richness, the global Biodiversity Mapping interface transitions from a blank or default basemap to display a vibrant heat map. This heat map highlights areas where hummingbird species are concentrated.
Determine geographic distribution
Hummingbirds (family Trochilidae) are native exclusively to the Americas (the Western Hemisphere/New World). Therefore, the map focuses on North, Central, and South America, with the highest concentration of species in the Neotropics (Central and South America, particularly the Andes region).
Interpret heat map colors
Using Heat Map Interpretation principles, species richness maps typically use a color gradient:
- Warm colors (reds, oranges, yellows) represent high species richness (many species overlapping in that area).
- Cool colors (blues, purples, greens) represent lower species richness (fewer species).
- Dark or uncolored areas represent zero or near-zero species.
Evaluate species estimation capability
Under the "Richness" tab at a high resolution (~1km²), the map displays a color scale corresponding to numerical ranges of species counts. By using the legend, a user can estimate the number of hummingbird species present in a specific geographic pixel.
</reasoning>
<answer>
Part 2
Question 1
The map updates to display a colorful heat map concentrated over the Americas, showing varying color intensities that represent hummingbird species distribution.
Question 2
You are observing the Western Hemisphere, specifically North America, Central America, and South America.
Question 3
The map displays a gradient of colors, typically ranging from cool colors like blue and green in areas with fewer species, to warm colors like yellow, orange, and bright red in areas with high species concentration.
Question 4
These colors represent species richness, which is the number of different hummingbird species found within a given area (at the selected \(1\text{ km}^2\) resolution).
---
Part 3
Question 1
Yes, by matching the color of a specific location on the map to the numerical values on the map's color legend, you can estimate the number of hummingbird species present in that particular place.
</answer>
<post_analysis>
{
"subject": "Natural Science",
"question_type": "Multi-part",
"knowledge_point": [
"Natural Science",
"Biology",
"Conservation Biology"
]
}
</post_analysis>

Snap & solve any problem in the app
Get step-by-step solutions on Sovi AI
Photo-based solutions with guided steps
Explore more problems and detailed explanations
<pre_analysis>
{
"quality": "clear",
"question_count": 5,
"skills_matched": [
"direct_cot",
"explain_then_answer",
"tutor"
],
"needs_drawing": false,
"concepts_used": [
"Half-Earth Project",
"Biodiversity Mapping",
"Heat Map Interpretation"
],
"new_concepts": [
"Species Richness Mapping",
"Hummingbird Distribution"
],
"current_concepts": [
"Half-Earth Project",
"Biodiversity Mapping",
"Heat Map Interpretation",
"Species Richness Mapping",
"Hummingbird Distribution"
]
}
</pre_analysis>
<reasoning>
Identify the interactive mapping context
The questions refer to an interactive GIS mapping tool, specifically the Half-Earth Project Map. The user is instructed to select "Richness", set the resolution to "~1km² resolution", and select "Hummingbirds" under the Biodiversity layers.
Analyze map changes for hummingbirds
When selecting "Hummingbirds" under species richness, the global Biodiversity Mapping interface transitions from a blank or default basemap to display a vibrant heat map. This heat map highlights areas where hummingbird species are concentrated.
Determine geographic distribution
Hummingbirds (family Trochilidae) are native exclusively to the Americas (the Western Hemisphere/New World). Therefore, the map focuses on North, Central, and South America, with the highest concentration of species in the Neotropics (Central and South America, particularly the Andes region).
Interpret heat map colors
Using Heat Map Interpretation principles, species richness maps typically use a color gradient:
- Warm colors (reds, oranges, yellows) represent high species richness (many species overlapping in that area).
- Cool colors (blues, purples, greens) represent lower species richness (fewer species).
- Dark or uncolored areas represent zero or near-zero species.
Evaluate species estimation capability
Under the "Richness" tab at a high resolution (~1km²), the map displays a color scale corresponding to numerical ranges of species counts. By using the legend, a user can estimate the number of hummingbird species present in a specific geographic pixel.
</reasoning>
<answer>
Part 2
Question 1
The map updates to display a colorful heat map concentrated over the Americas, showing varying color intensities that represent hummingbird species distribution.
Question 2
You are observing the Western Hemisphere, specifically North America, Central America, and South America.
Question 3
The map displays a gradient of colors, typically ranging from cool colors like blue and green in areas with fewer species, to warm colors like yellow, orange, and bright red in areas with high species concentration.
Question 4
These colors represent species richness, which is the number of different hummingbird species found within a given area (at the selected \(1\text{ km}^2\) resolution).
---
Part 3
Question 1
Yes, by matching the color of a specific location on the map to the numerical values on the map's color legend, you can estimate the number of hummingbird species present in that particular place.
</answer>
<post_analysis>
{
"subject": "Natural Science",
"question_type": "Multi-part",
"knowledge_point": [
"Natural Science",
"Biology",
"Conservation Biology"
]
}
</post_analysis>