QUESTION IMAGE
Question
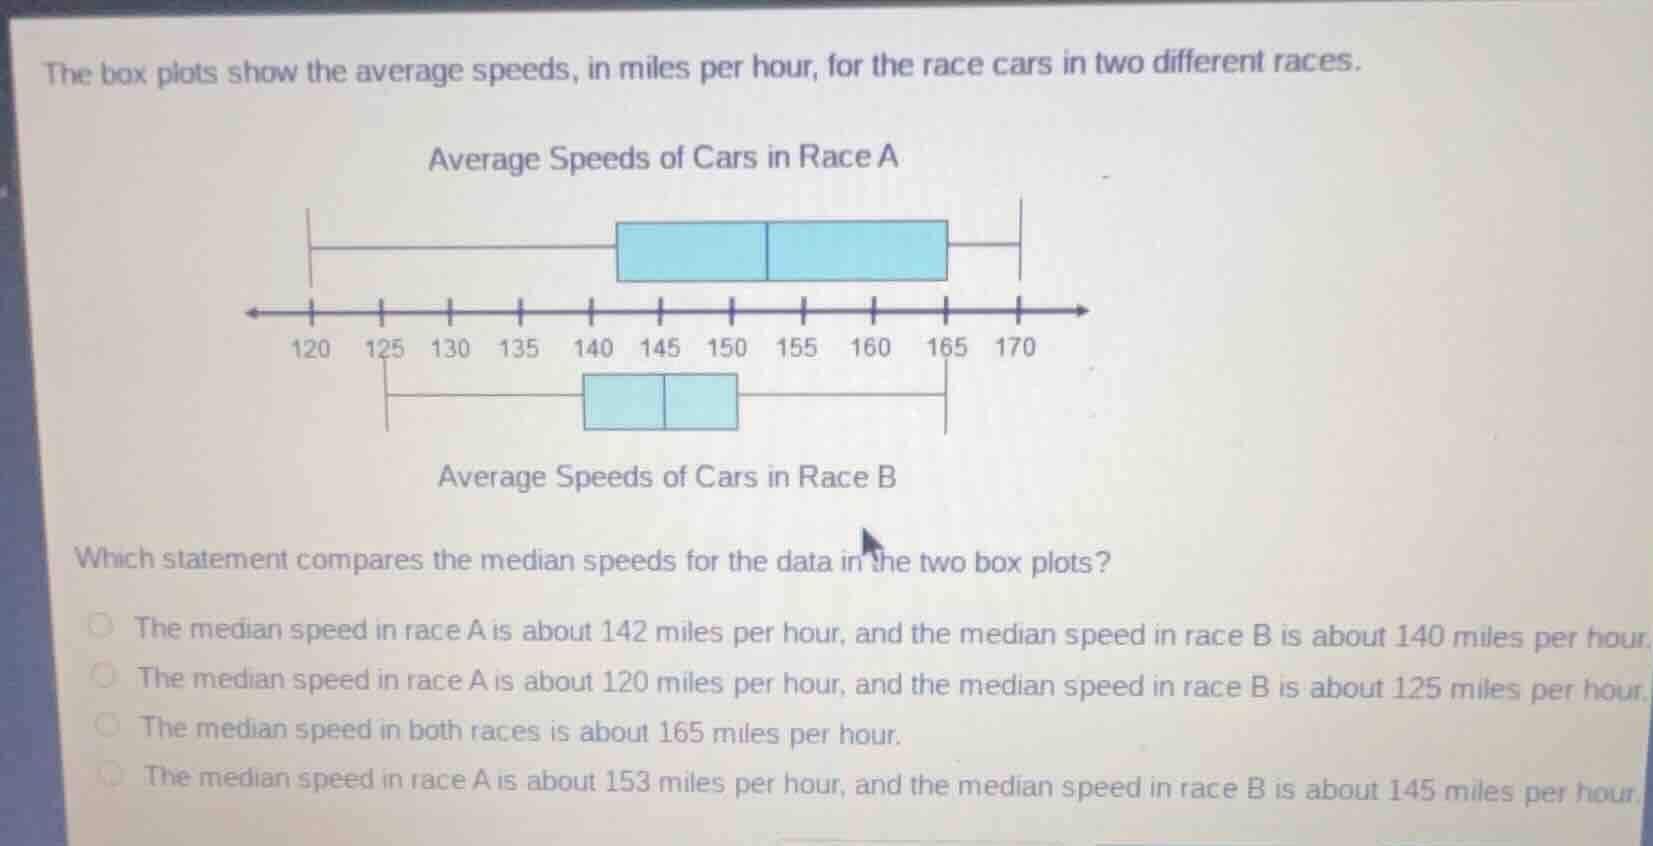
the box plots show the average speeds, in miles per hour, for the race cars in two different races.
average speeds of cars in race a
average speeds of cars in race b
which statement compares the median speeds for the data in the two box plots?
the median speed in race a is about 142 miles per hour, and the median speed in race b is about 140 miles per hour.
the median speed in race a is about 120 miles per hour, and the median speed in race b is about 125 miles per hour.
the median speed in both races is about 165 miles per hour.
the median speed in race a is about 153 miles per hour, and the median speed in race b is about 145 miles per hour.

Snap & solve any problem in the app
Get step-by-step solutions on Sovi AI
Photo-based solutions with guided steps
Explore more problems and detailed explanations
D. The median speed in race A is about 153 miles per hour, and the median speed in race B is about 145 miles per hour.