QUESTION IMAGE
Question
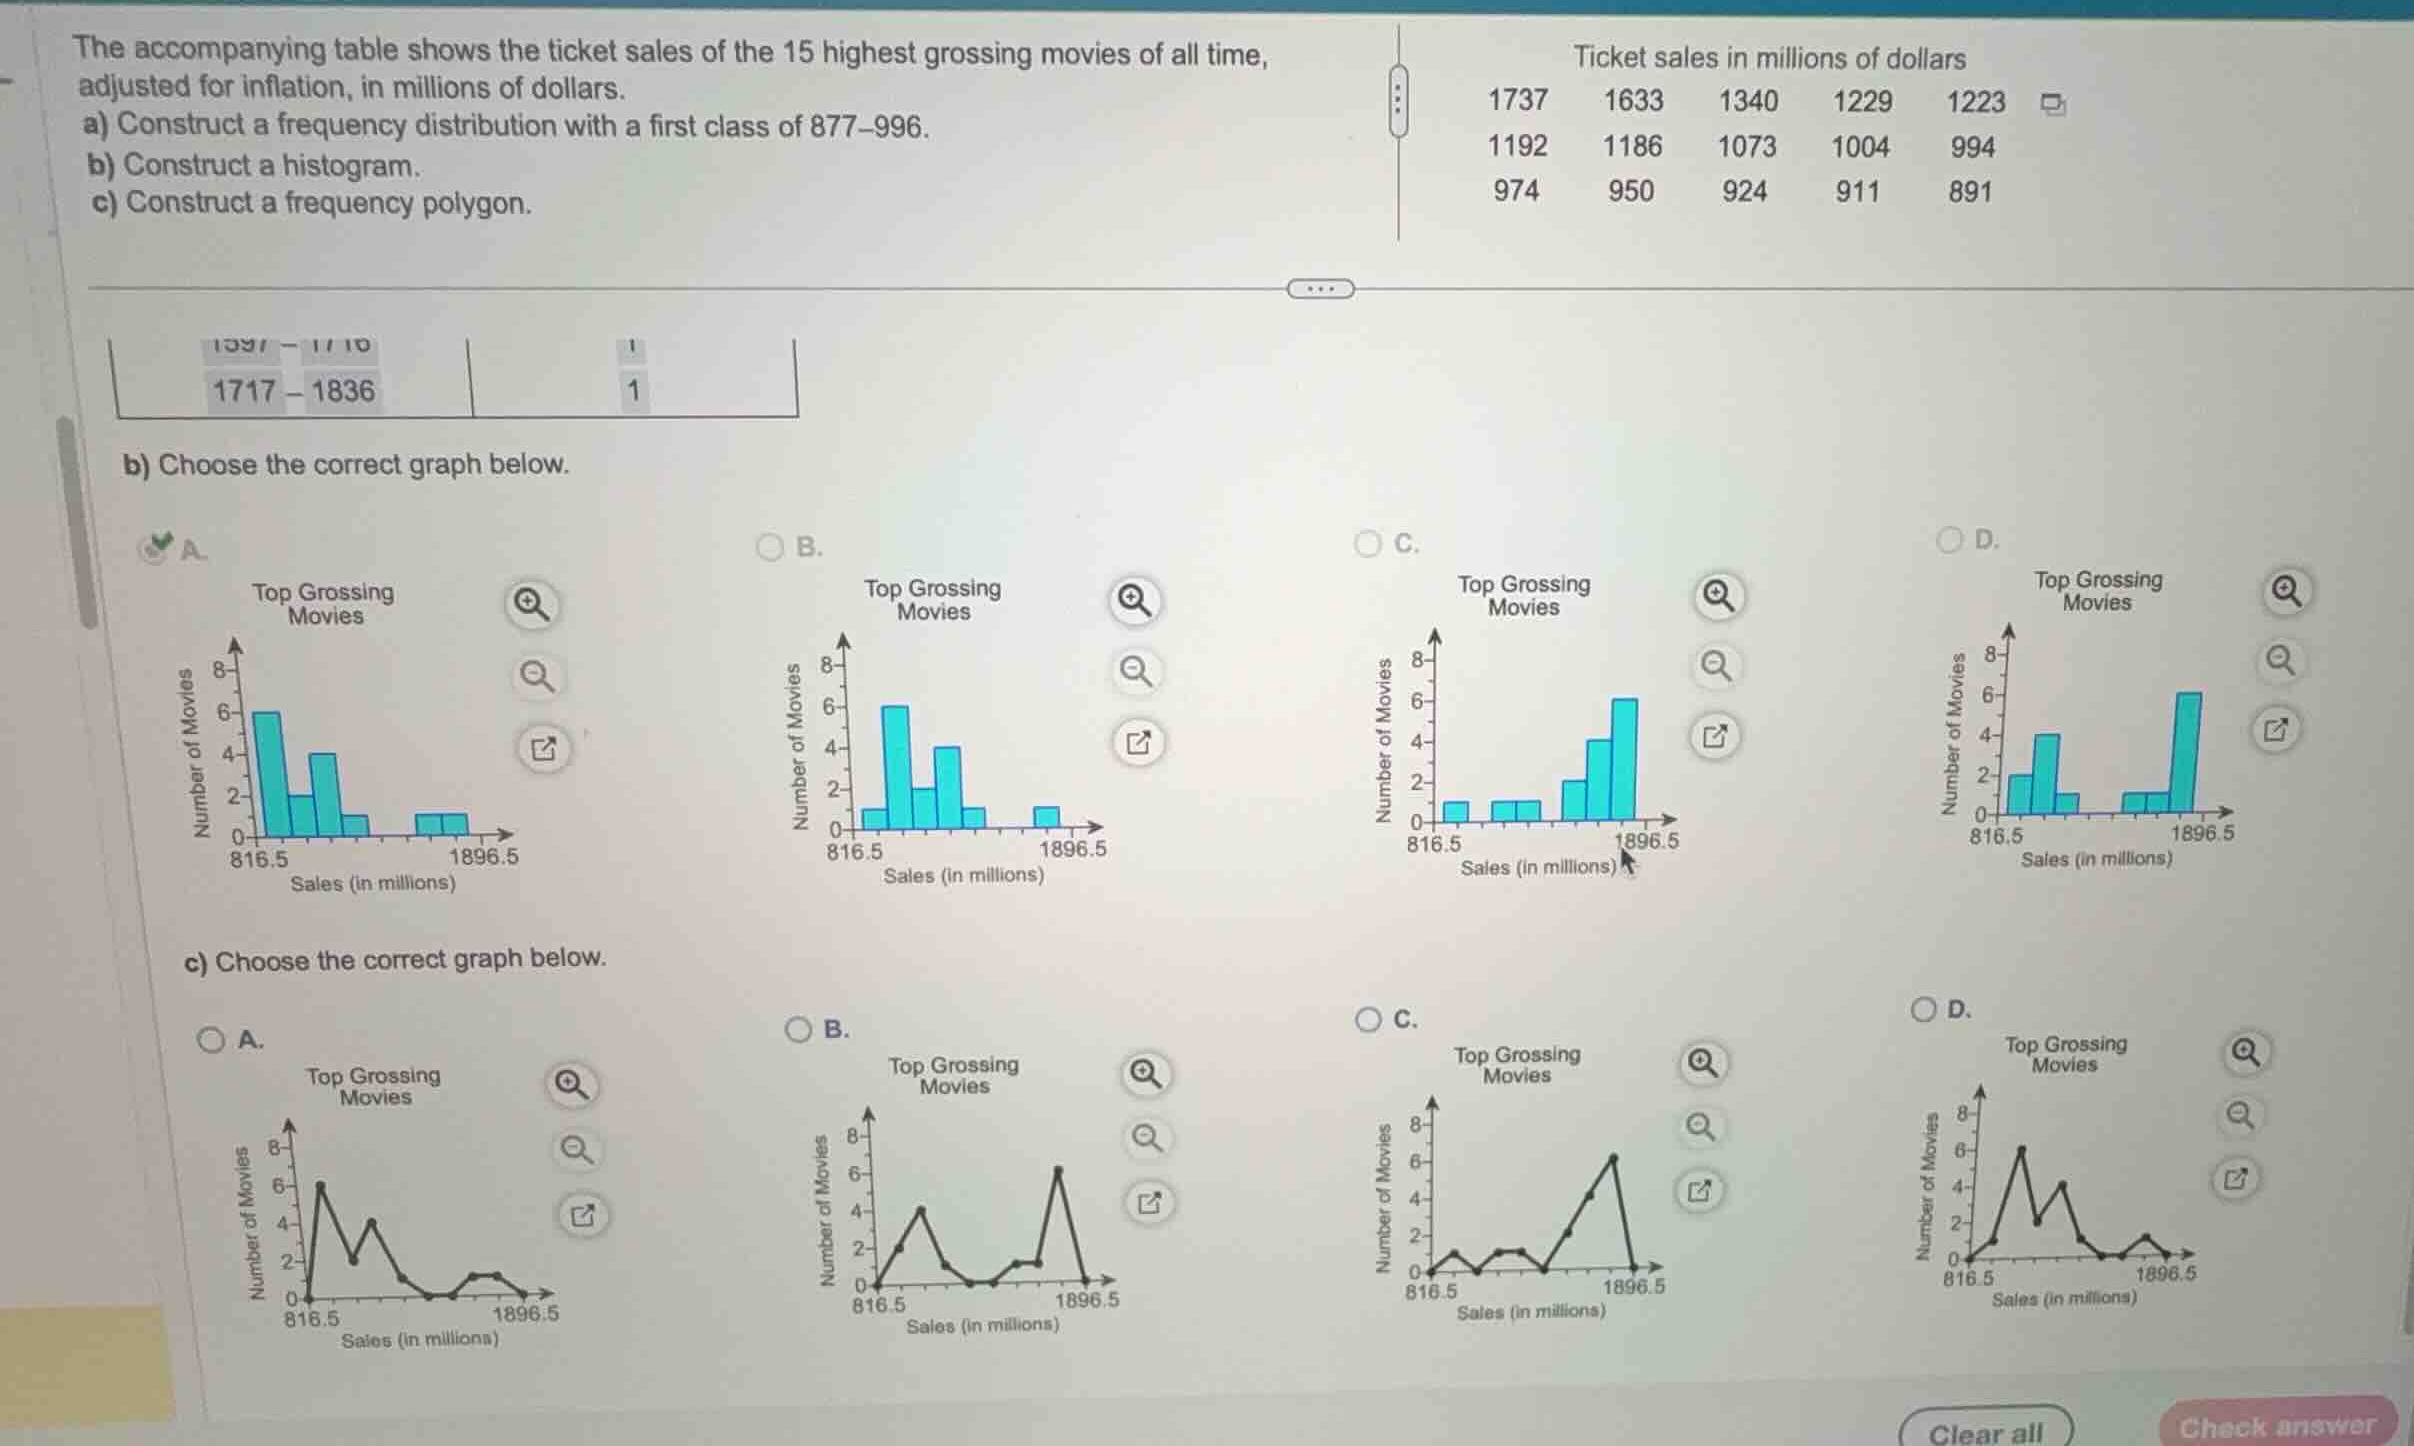
the accompanying table shows the ticket sales of the 15 highest grossing movies of all time, adjusted for inflation, in millions of dollars.
a) construct a frequency distribution with a first class of 877-996.
b) construct a histogram.
c) construct a frequency polygon.
ticket sales in millions of dollars
1737 1633 1340 1229 1223
1192 1186 1073 1004 994
974 950 924 911 891
b) choose the correct graph below.
c) choose the correct graph below.
Determine the class intervals and frequencies
Using the Frequency Distribution knowledge point, we first analyze the data and classes.
The data values (ticket sales in millions) are:
\(891, 911, 924, 950, 974, 994, 1004, 1073, 1186, 1192, 1223, 1229, 1340, 1633, 1737\).
The first class is \(877\text{--}996\).
The class width is \(996 - 877 + 1 = 120\).
The classes and their corresponding frequencies are:
- \(877\text{--}996\): \(891, 911, 924, 950, 974, 994\) (6 values) \(
ightarrow\) Frequency = \(6\)
- \(997\text{--}1116\): \(1004, 1073\) (2 values) \(
ightarrow\) Frequency = \(2\)
- \(1117\text{--}1236\): \(1186, 1192, 1223, 1229\) (4 values) \(
ightarrow\) Frequency = \(4\)
- \(1237\text{--}1356\): \(1340\) (1 value) \(
ightarrow\) Frequency = \(1\)
- \(1357\text{--}1476\): None (0 values) \(
ightarrow\) Frequency = \(0\)
- \(1477\text{--}1596\): None (0 values) \(
ightarrow\) Frequency = \(0\)
- \(1597\text{--}1716\): None (0 values) \(
ightarrow\) Frequency = \(0\)
- \(1717\text{--}1836\): \(1737\) (1 value) \(
ightarrow\) Frequency = \(1\)
Identify the correct histogram
Using the Histogram Construction knowledge point, we match the frequencies to the bar heights.
The class boundaries start at \(877 - 0.5 = 816.5\) (or rather, \(877 - 60.5 = 816.5\) if we include an empty preceding class boundary, but let's look at the labels).
The labels on the x-axis start at \(816.5\) and end at \(1896.5\).
The frequencies of the consecutive classes starting from \(877\text{--}996\) are:
\(6, 2, 4, 1, 0, 0, 1\).
Looking at the histogram options:
- Option A: Bar heights are \(6, 2, 4, 1, 0, 0, 1\).
- Option B: Bar heights are \(1, 6, 2, 4, 1, 0, 0, 1\) (shifted).
- Option C: Bar heights are increasing towards the right.
- Option D: Bar heights are \(2, 4, 1, 0, 1, 0, 6\).
Thus, Option A is the correct histogram.
Identify the correct frequency polygon
A frequency polygon plots points at the class midpoints with heights equal to the class frequencies, and connects them with straight lines, anchoring to the horizontal axis at the midpoints of empty classes at both ends.
The frequencies at the consecutive midpoints are:
\(6, 2, 4, 1, 0, 0, 1\).
Looking at the frequency polygon options:
- Option A: The peaks and values correspond to heights of \(6, 2, 4, 1, 0, 0, 1\).
- Option B: The first major peak is at \(4\), which is incorrect.
- Option C: The peak is near the right side, which is incorrect.
- Option D: The peak is at \(6\), then drops, then rises to \(4\), but the shape does not match the correct sequence of frequencies.
Thus, Option A is the correct frequency polygon.

Snap & solve any problem in the app
Get step-by-step solutions on Sovi AI
Photo-based solutions with guided steps
Explore more problems and detailed explanations
Question b
- A. The histogram with bar heights of 6, 2, 4, 1, 0, 0, 1 starting from the first class. (Correct answer)
- B. The histogram with shifted bar heights starting with a height of 1.
- C. The histogram showing increasing bar heights towards the right.
- D. The histogram with bar heights of 2, 4, 1, 0, 1, 0, 6.
Question c
- A. The frequency polygon with consecutive peak values of 6, 2, 4, 1, 0, 0, 1. (Correct answer)
- B. The frequency polygon with a first peak at 4.
- C. The frequency polygon with a peak near the right side.
- D. The frequency polygon with incorrect intermediate values.