QUESTION IMAGE
Question
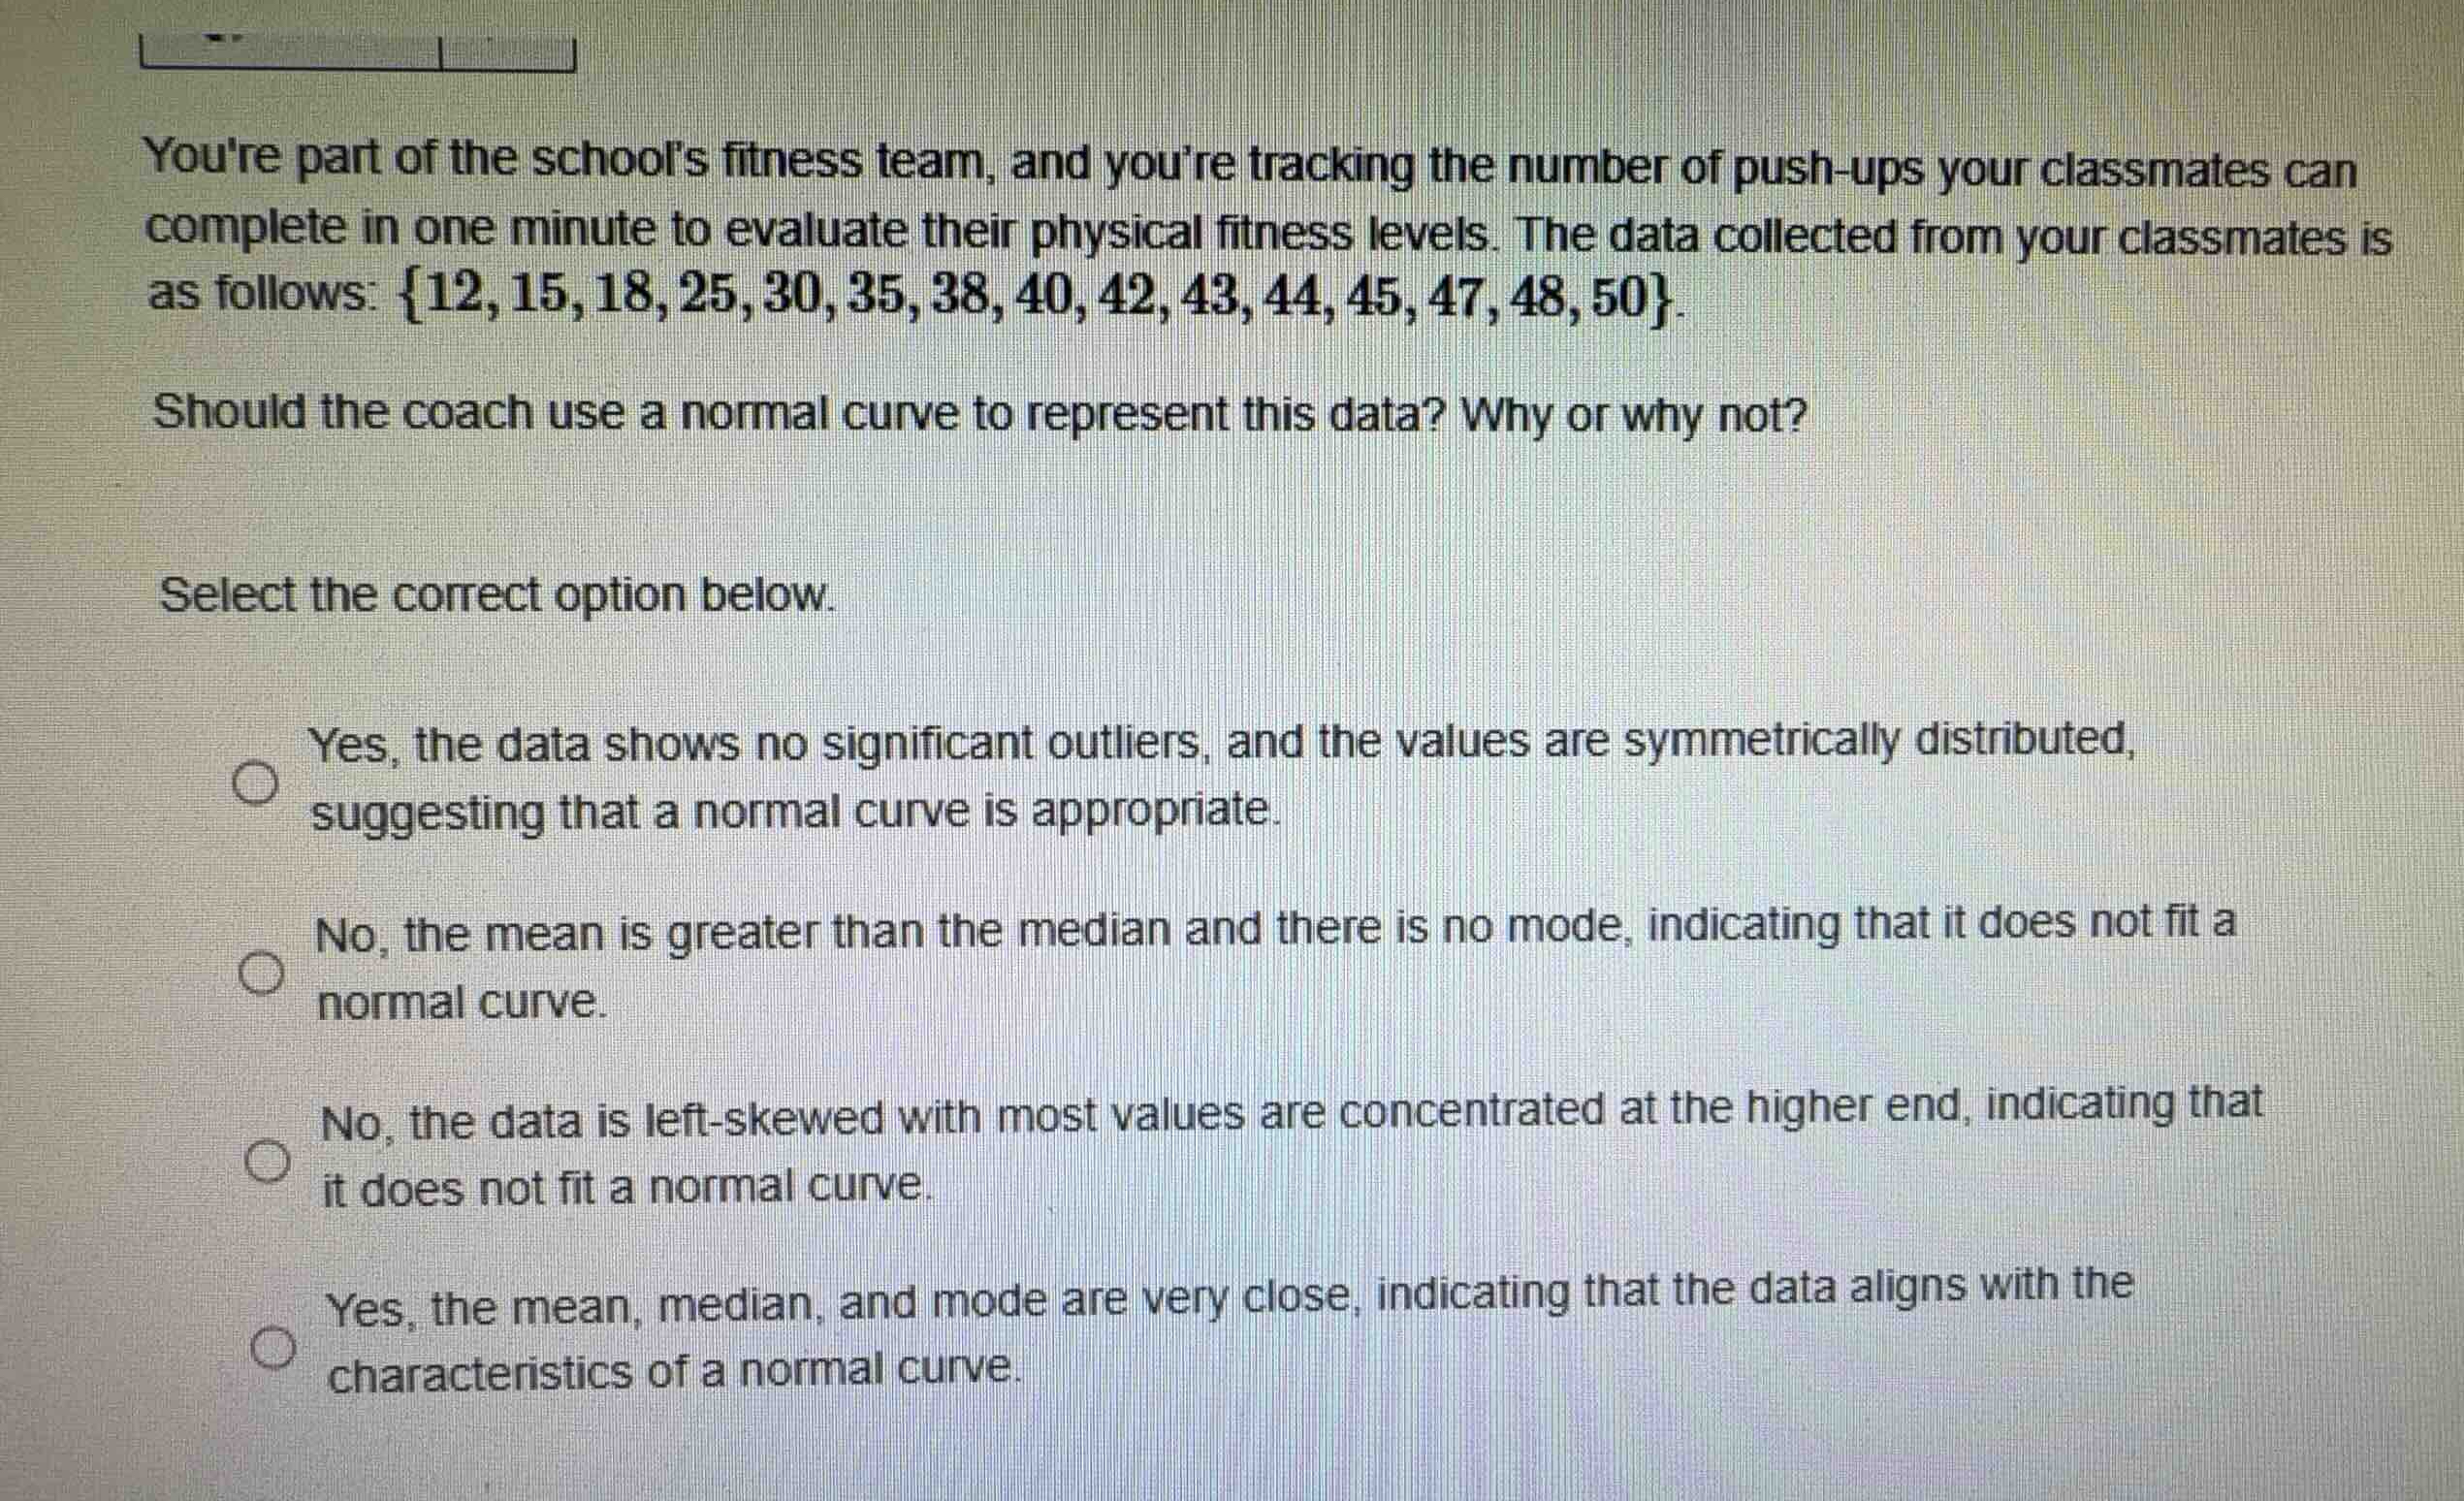
youre part of the schools fitness team, and youre tracking the number of push-ups your classmates can complete in one minute to evaluate their physical fitness levels. the data collected from your classmates is as follows: \\{12, 15, 18, 25, 30, 35, 38, 40, 42, 43, 44, 45, 47, 48, 50\\}.
should the coach use a normal curve to represent this data? why or why not?
select the correct option below.
yes, the data shows no significant outliers, and the values are symmetrically distributed, suggesting that a normal curve is appropriate.
no, the mean is greater than the median and there is no mode, indicating that it does not fit a normal curve.
no, the data is left-skewed with most values are concentrated at the higher end, indicating that it does not fit a normal curve.
yes, the mean, median, and mode are very close, indicating that the data aligns with the characteristics of a normal curve.
Calculate the mean and median of the dataset
Analyze skewness and shape of the distribution
Determine normal curve suitability

Snap & solve any problem in the app
Get step-by-step solutions on Sovi AI
Photo-based solutions with guided steps
Explore more problems and detailed explanations
- Yes, the data shows no significant outliers, and the values are symmetrically distributed, suggesting that a normal curve is appropriate.
- (B) No, the mean is greater than the median and there is no mode, indicating that it does not fit a normal curve.
- No, the data is left-skewed with most values are concentrated at the higher end, indicating that it does not fit a normal curve. (Correct answer)
- Yes, the mean, median, and mode are very close, indicating that the data aligns with the characteristics of a normal curve.