QUESTION IMAGE
Question
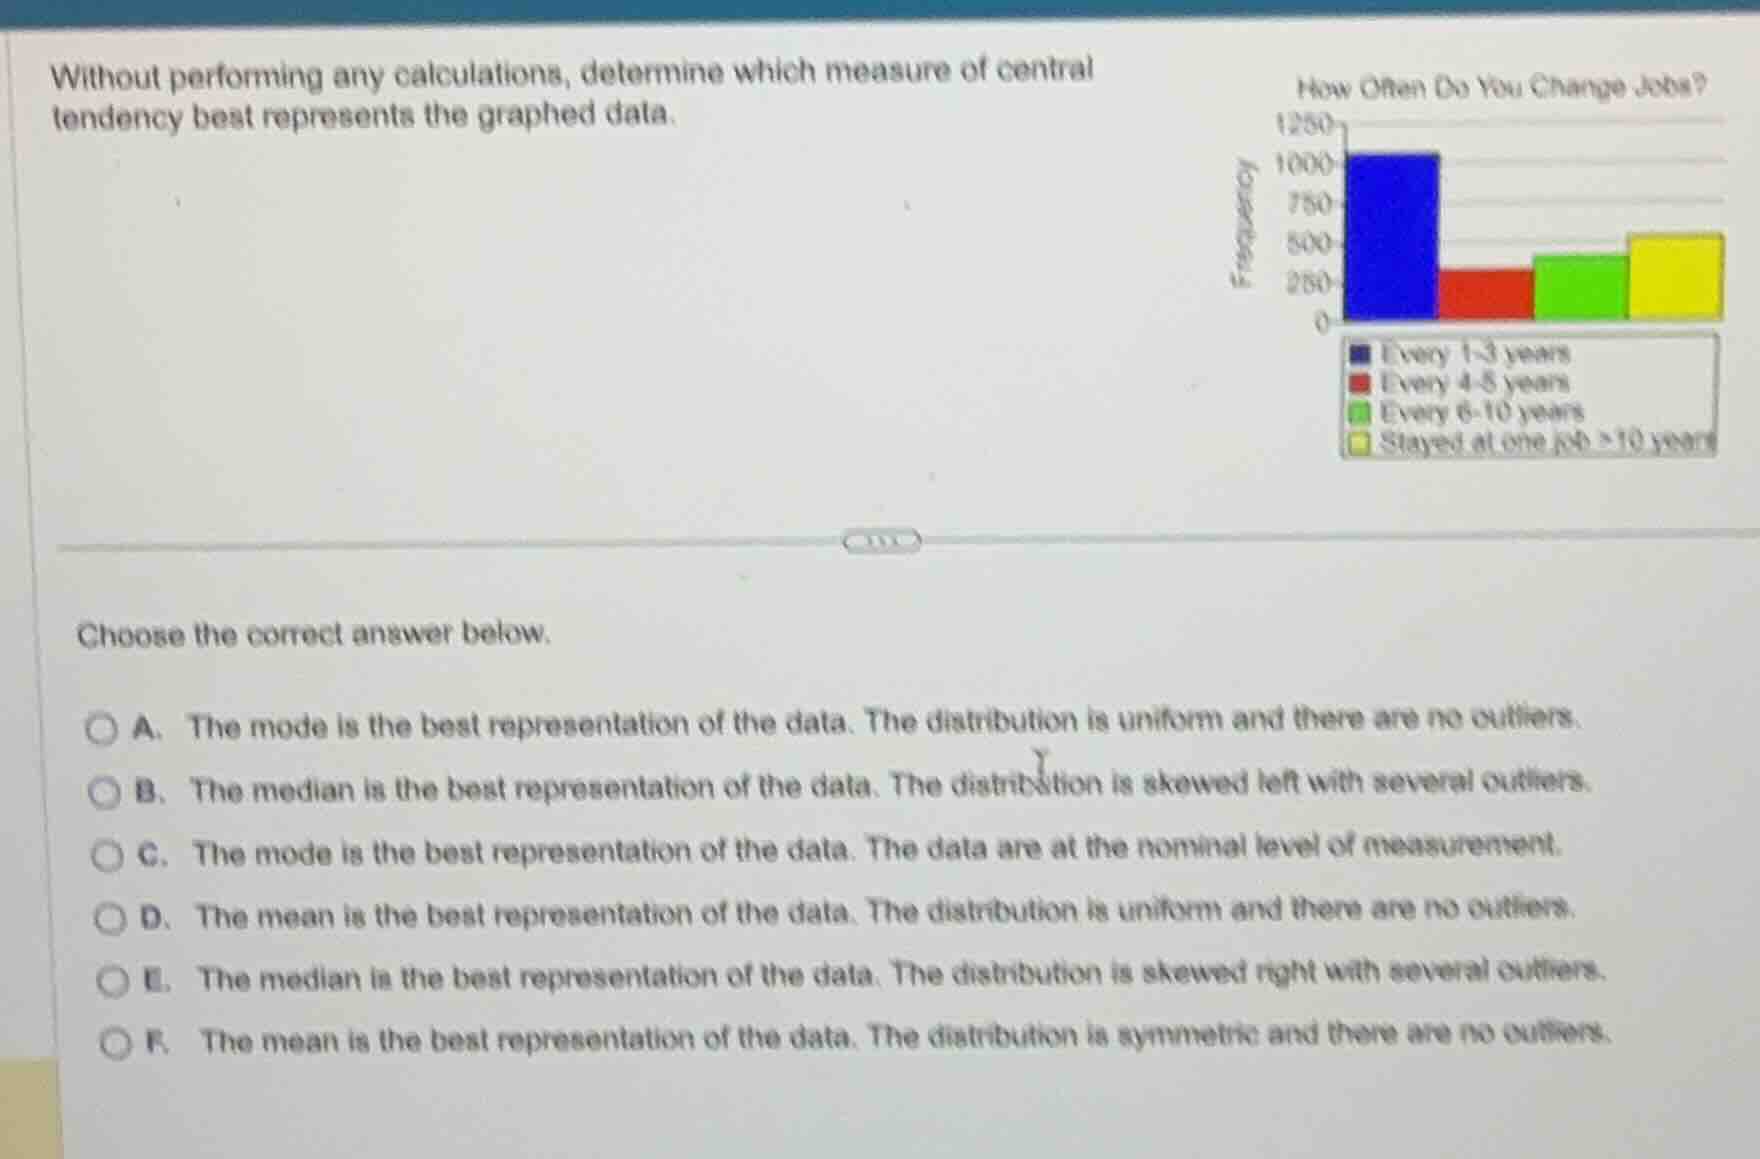
without performing any calculations, determine which measure of central tendency best represents the graphed data.
choose the correct answer below.
a. the mode is the best representation of the data. the distribution is uniform and there are no outliers.
b. the median is the best representation of the data. the distribution is skewed left with several outliers.
c. the mode is the best representation of the data. the data are at the nominal level of measurement.
d. the mean is the best representation of the data. the distribution is uniform and there are no outliers.
e. the median is the best representation of the data. the distribution is skewed right with several outliers.
f. the mean is the best representation of the data. the distribution is symmetric and there are no outliers.
Identify the level of measurement of the data
The categories on the horizontal axis are qualitative/categorical: "Every 1-3 years", "Every 4-5 years", "Every 6-10 years", and "Stayed at one job >10 years". Since these represent non-numerical categories of job change frequency, the data is at the nominal level of measurement.
Determine the appropriate measure of central tendency
For nominal data, numerical calculations like the mean or median cannot be computed because the categories cannot be meaningfully ordered or averaged. Therefore, the mode (the most frequent category) is the only appropriate measure of central tendency to represent this data.

Snap & solve any problem in the app
Get step-by-step solutions on Sovi AI
Photo-based solutions with guided steps
Explore more problems and detailed explanations
- A. The mode is the best representation of the data. The distribution is uniform and there are no outliers.
- B. The median is the best representation of the data. The distribution is skewed left with several outliers.
- C. The mode is the best representation of the data. The data are at the nominal level of measurement. (Correct answer)
- D. The mean is the best representation of the data. The distribution is uniform and there are no outliers.
- E. The median is the best representation of the data. The distribution is skewed right with several outliers.
- F. The mean is the best representation of the data. The distribution is symmetric and there are no outliers.