QUESTION IMAGE
Question
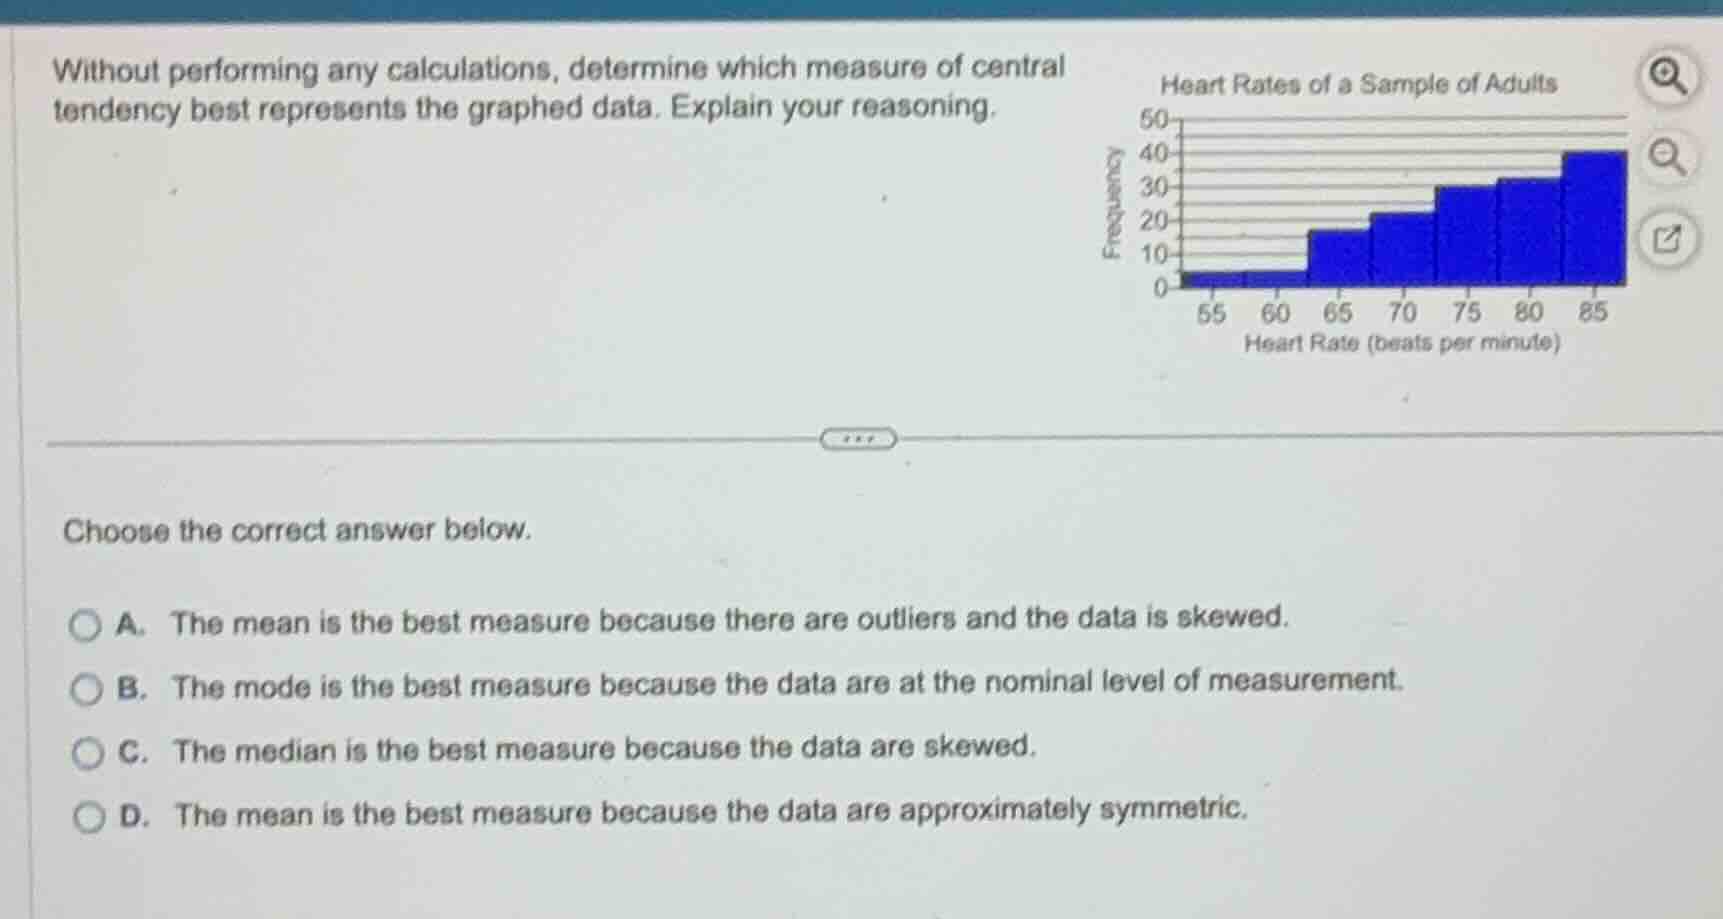
without performing any calculations, determine which measure of central tendency best represents the graphed data. explain your reasoning.
choose the correct answer below.
a. the mean is the best measure because there are outliers and the data is skewed.
b. the mode is the best measure because the data are at the nominal level of measurement.
c. the median is the best measure because the data are skewed.
d. the mean is the best measure because the data are approximately symmetric.
Analyze the shape of the histogram
The histogram shows heart rates of a sample of adults. The frequencies are very low on the left side (values 55–60) and steadily increase toward the right side (values 80–85). This indicates a distribution with a long tail on the left, which is left-skewed (skewed to the left).
Determine the best measure of central tendency
For skewed distributions, the mean is pulled toward the tail (the lower values in this case), making it less representative of the typical data point. The median is resistant to extreme values and skewness, making it the best measure of central tendency for skewed data.
Match with the multiple-choice options
Option C states: "The median is the best measure because the data are skewed." This matches the analysis.

Snap & solve any problem in the app
Get step-by-step solutions on Sovi AI
Photo-based solutions with guided steps
Explore more problems and detailed explanations
- A. The mean is the best measure because there are outliers and the data is skewed.
- B. The mode is the best measure because the data are at the nominal level of measurement.
- C. The median is the best measure because the data are skewed. (Correct answer)
- D. The mean is the best measure because the data are approximately symmetric.