QUESTION IMAGE
Question
which statement is true?
there is no relationship between the height of the plant and its age.
although the outlier is an extreme value, it should be included in the interpretation.
by excluding the outlier, a better description can be given for the data set.
Analyze the scatterplot trend and outlier
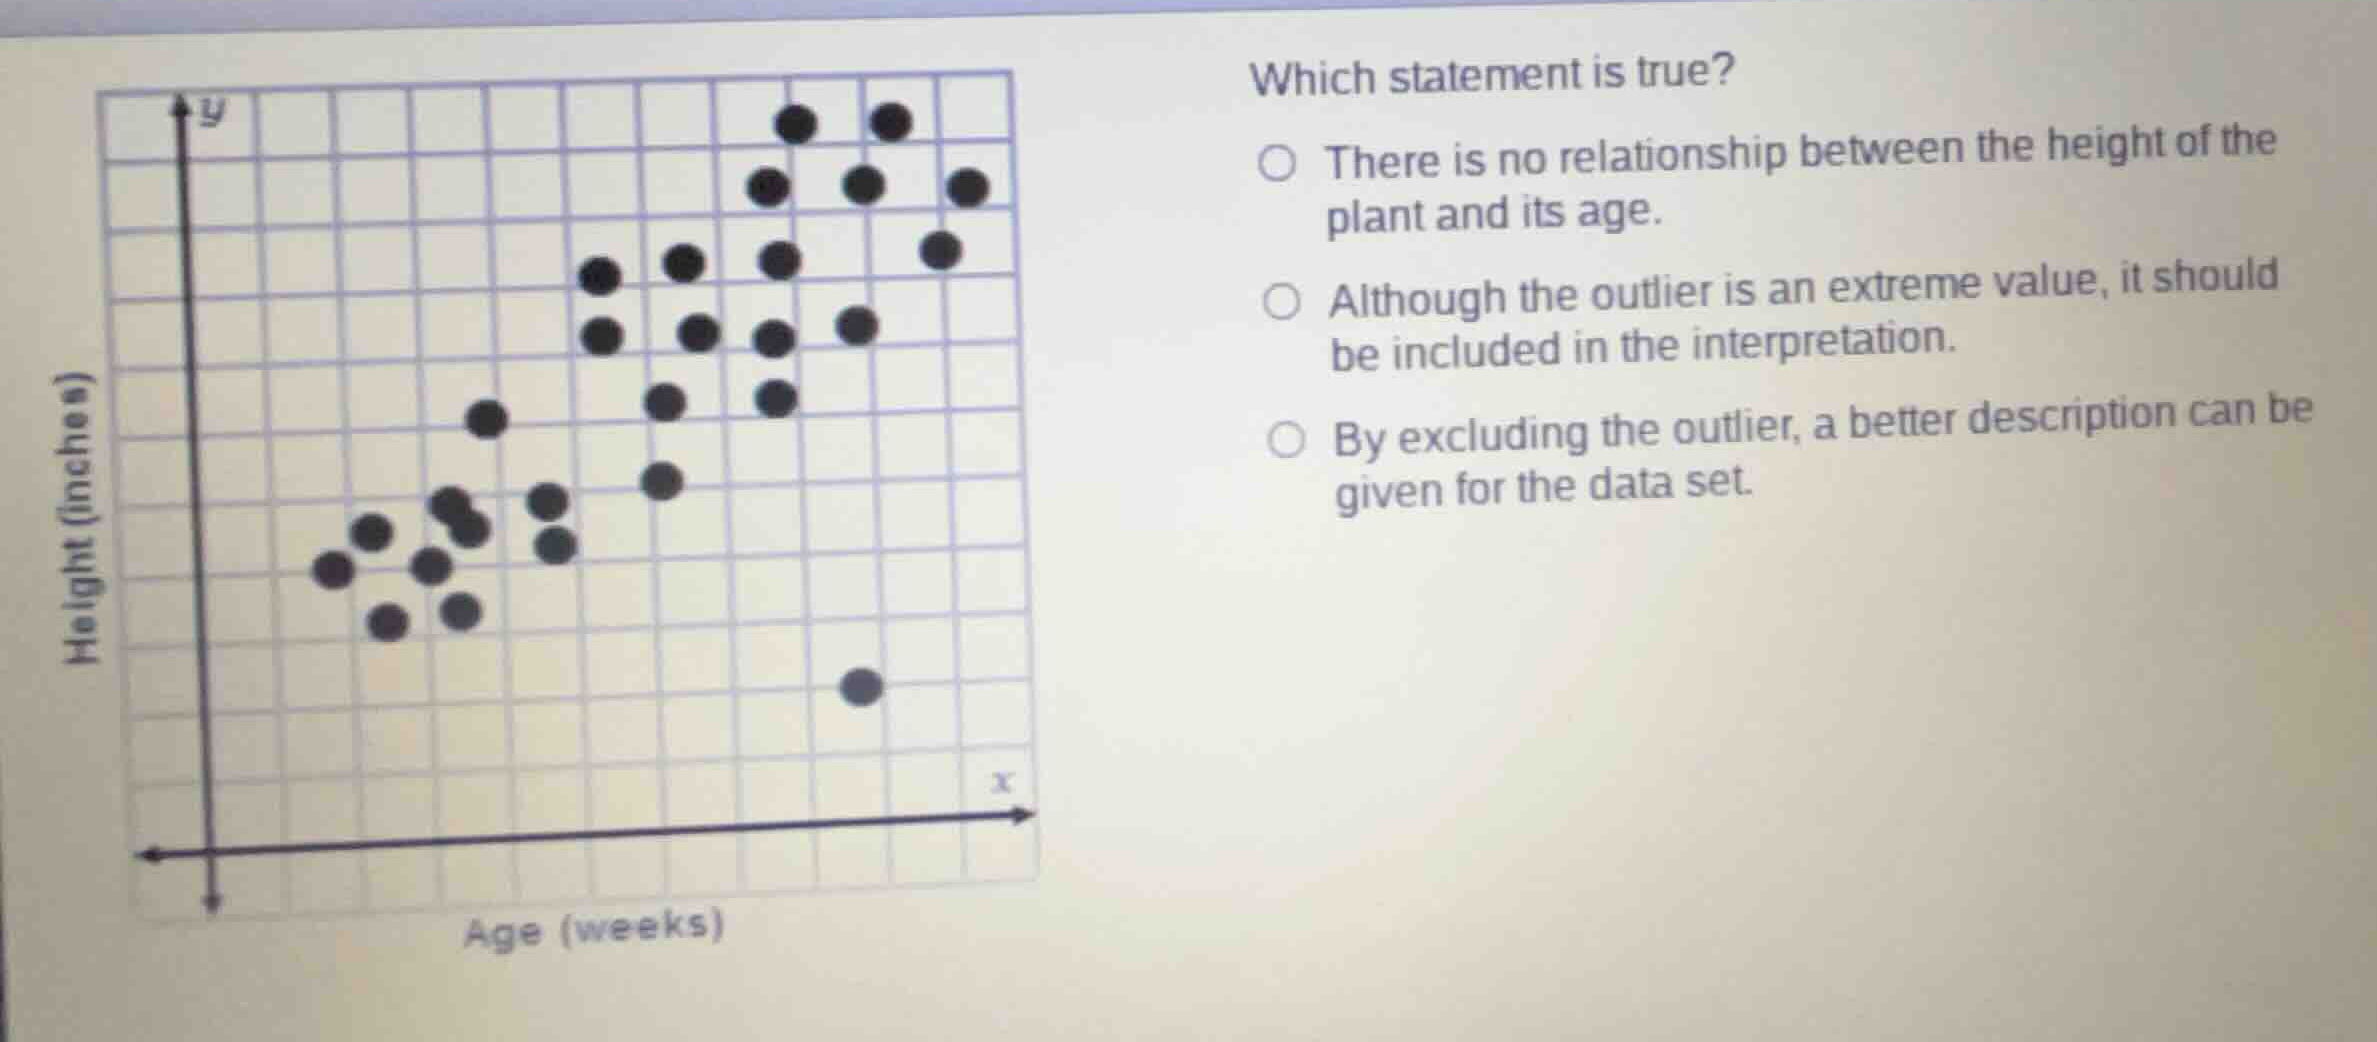
The scatterplot shows a strong positive linear relationship between the age of the plant (x-axis) and its height (y-axis), with one clear outlier located far below the main cluster of data points near the bottom right.
Evaluate the statements
- Statement 1: "There is no relationship between the height of the plant and its age." This is false because there is a clear positive trend.
- Statement 2: "Although the outlier is an extreme value, it should be included in the interpretation." This is false because including this outlier would distort the overall strong positive relationship of the healthy growing plants.
- Statement 3: "By excluding the outlier, a better description can be given for the data set." This is true because removing the outlier allows a much more accurate linear model to describe the general growth trend of the plants.

Snap & solve any problem in the app
Get step-by-step solutions on Sovi AI
Photo-based solutions with guided steps
Explore more problems and detailed explanations
- There is no relationship between the height of the plant and its age.
- Although the outlier is an extreme value, it should be included in the interpretation.
- By excluding the outlier, a better description can be given for the data set. (Correct answer)