QUESTION IMAGE
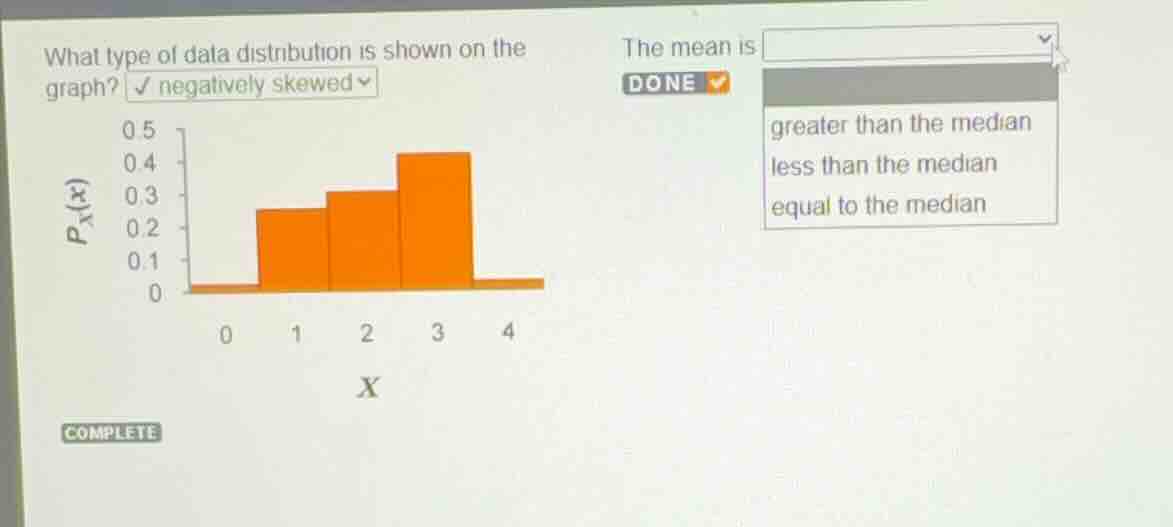
Question
what type of data distribution is shown on the graph? negatively skewed
the mean is
greater than the median
less than the median
equal to the median
Identify the distribution type
Using the Skewed Distribution Properties knowledge point
The histogram shows a distribution with a longer tail extending to the left (towards lower values like 0) and the peak on the right (at 3). This shape is characteristic of a negatively skewed (or left-skewed) distribution.
Compare the mean and the median
Using the Mean vs Median in Skewed Data knowledge points
In a negatively skewed distribution, the extreme low values in the left tail pull the mean down more than they affect the median. Consequently, the mean is pulled to the left of the median.
Therefore, the mean is less than the median.

Snap & solve any problem in the app
Get step-by-step solutions on Sovi AI
Photo-based solutions with guided steps
Explore more problems and detailed explanations
- greater than the median
- less than the median (Correct answer)
- equal to the median