QUESTION IMAGE
Question
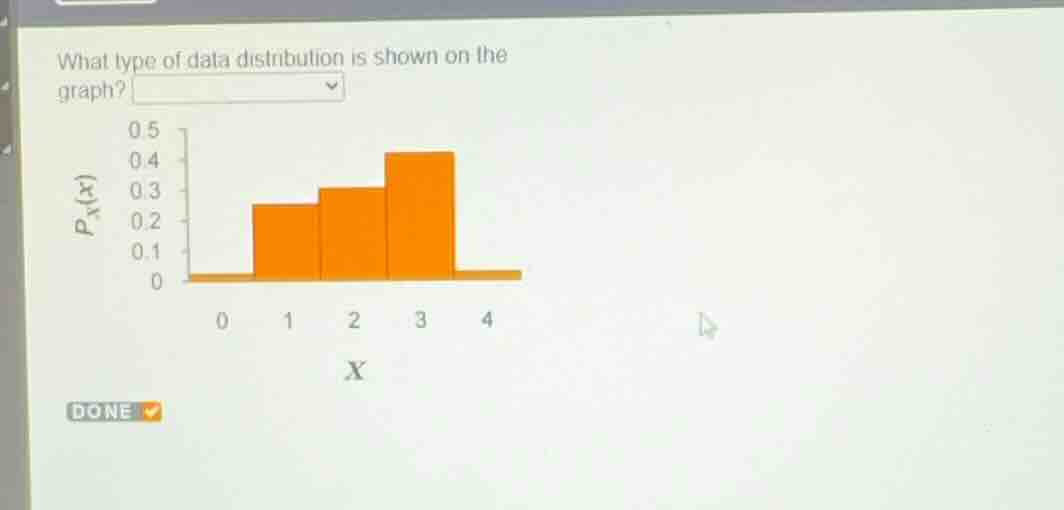
what type of data distribution is shown on the graph?
Analyze the shape of the distribution
Using the Skewed Distribution Properties knowledge point
- The peak of the probability distribution occurs at \(X = 3\).
- The distribution has a longer tail extending to the left (towards \(X = 0\)) compared to the right.
- A distribution with a longer or fatter tail on the left side is classified as left-skewed (or negatively skewed).

Snap & solve any problem in the app
Get step-by-step solutions on Sovi AI
Photo-based solutions with guided steps
Explore more problems and detailed explanations
What type of data distribution is shown on the graph? <blank>skewed left</blank>