QUESTION IMAGE
Question
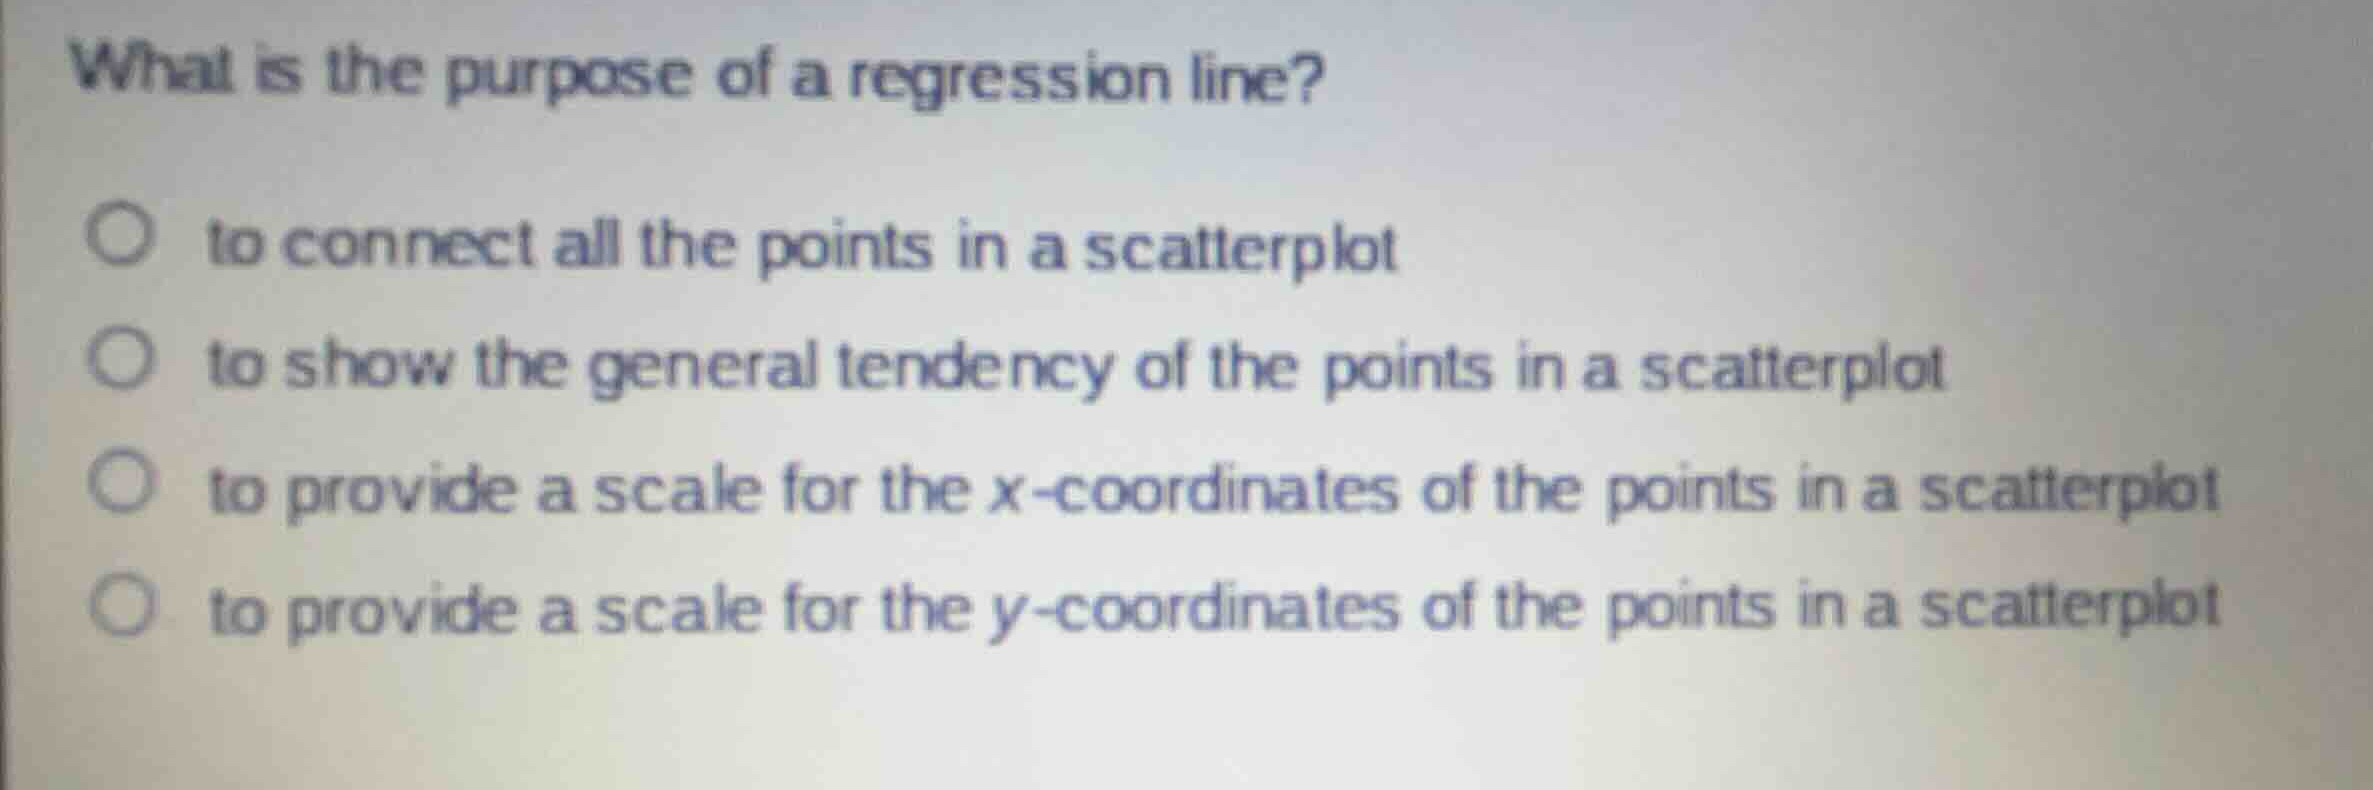
what is the purpose of a regression line?
to connect all the points in a scatterplot
to show the general tendency of the points in a scatterplot
to provide a scale for the \\(x\\)-coordinates of the points in a scatterplot
to provide a scale for the \\(y\\)-coordinates of the points in a scatterplot
Analyze the definition of a regression line
A regression line (or line of best fit) is a straight line drawn through the center of a group of data points on a scatterplot to show how the variables are generally related.
Evaluate the given options
- "to connect all the points in a scatterplot": Incorrect, as a straight line rarely passes through every single scattered data point.
- "to show the general tendency of the points in a scatterplot": Correct, because it models the overall trend or pattern of the bivariate data.
- "to provide a scale for the x-coordinates...": Incorrect, scales are provided by the axes.
- "to provide a scale for the y-coordinates...": Incorrect, scales are provided by the axes.

Snap & solve any problem in the app
Get step-by-step solutions on Sovi AI
Photo-based solutions with guided steps
Explore more problems and detailed explanations
- to connect all the points in a scatterplot
- to show the general tendency of the points in a scatterplot (Correct answer)
- to provide a scale for the x-coordinates of the points in a scatterplot
- to provide a scale for the y-coordinates of the points in a scatterplot