QUESTION IMAGE
Question
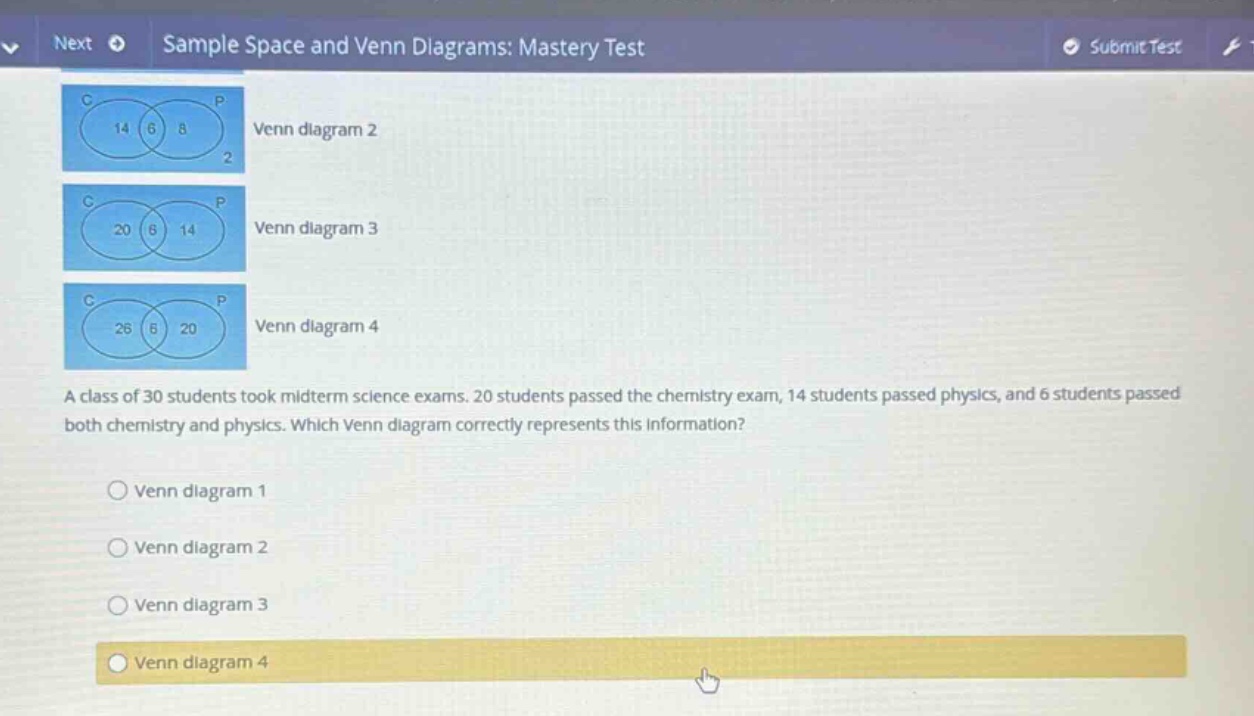
venn diagram 2
venn diagram 3
venn diagram 4
a class of 30 students took midterm science exams. 20 students passed the chemistry exam, 14 students passed physics, and 6 students passed both chemistry and physics. which venn diagram correctly represents this information?
- venn diagram 1
- venn diagram 2
- venn diagram 3
- venn diagram 4
⚡ Using what you learned: Venn Diagrams in Probability
Step 1: Identify the intersection
The number of students who passed both chemistry and physics goes in the overlapping region of the two circles:
Step 2: Calculate the chemistry-only region
Subtract the overlapping students from the total who passed chemistry:
Step 3: Calculate the physics-only region
Subtract the overlapping students from the total who passed physics:
Step 4: Identify the matching diagram
The correct diagram must have:
- \( 14 \) in the left section (Chemistry only)
- \( 6 \) in the middle section (Both)
- \( 8 \) in the right section (Physics only)
This matches Venn diagram 2.

Snap & solve any problem in the app
Get step-by-step solutions on Sovi AI
Photo-based solutions with guided steps
Explore more problems and detailed explanations
Venn diagram 2