QUESTION IMAGE
Question
3 - using statistics, analogies, and definitions to support your ideas
learning objective: explain how to use statistics, analogies, and definitions to support your message.
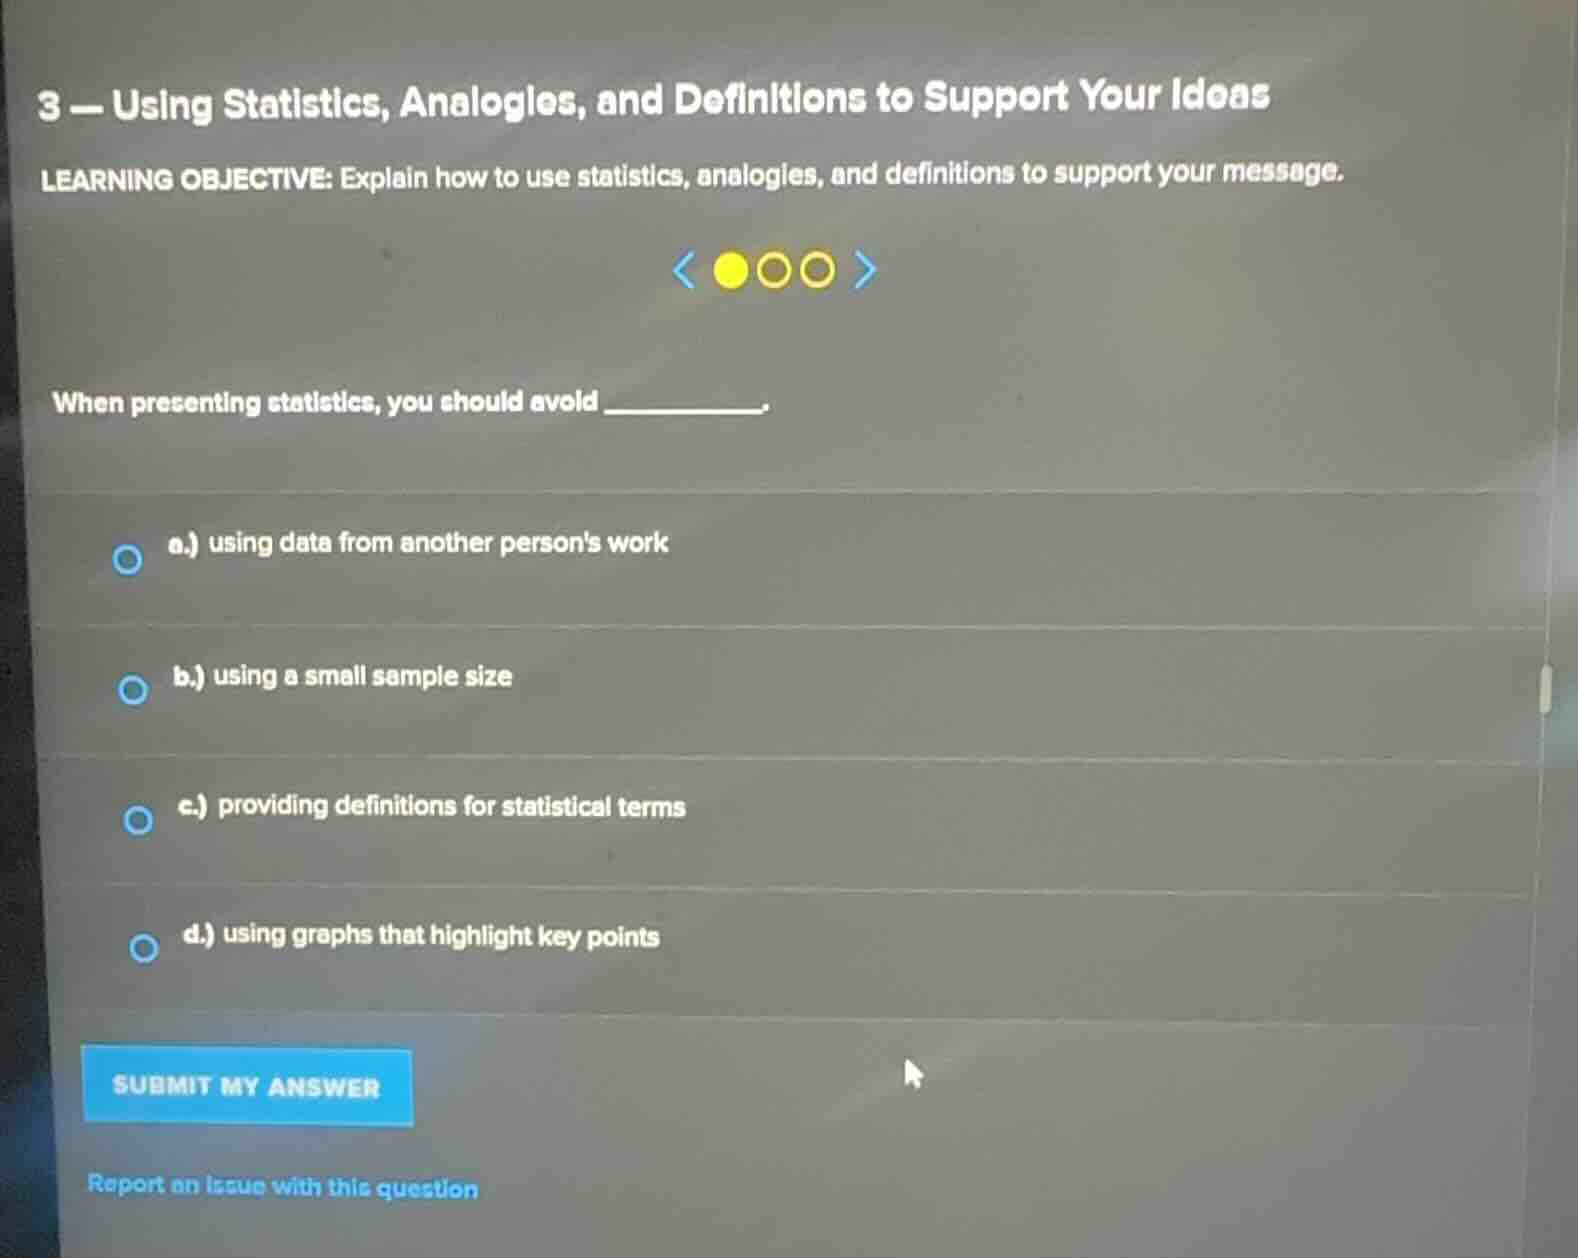
when presenting statistics, you should avoid ______.
a.) using data from another persons work
b.) using a small sample size
c.) providing definitions for statistical terms
d.) using graphs that highlight key points
Analyze the question prompt
The question asks what should be avoided when presenting statistics to support ideas.
Evaluate the options
- Option a (using data from another person's work) is standard practice in research and public speaking, provided it is properly cited.
- Option b (using a small sample size) introduces bias and reduces the reliability and validity of the statistical evidence, which should be avoided.
- Option c (providing definitions for statistical terms) helps the audience understand the data and is a good practice.
- Option d (using graphs that highlight key points) is an effective visual aid technique.
Determine the correct choice
Avoiding a small sample size ensures the statistical evidence is robust and credible.

Snap & solve any problem in the app
Get step-by-step solutions on Sovi AI
Photo-based solutions with guided steps
Explore more problems and detailed explanations
- a.) using data from another person's work
- b.) using a small sample size (Correct answer)
- c.) providing definitions for statistical terms
- d.) using graphs that highlight key points