QUESTION IMAGE
Question
use a table to find the indicated area under the standard normal curve. include an appropriately labeled sketch of the normal curve and shade the appropriate region.
a. find the area to the left of a z-score of \\(-0.96\\).
b. find the area to the right of a z-score of \\(-0.96\\).
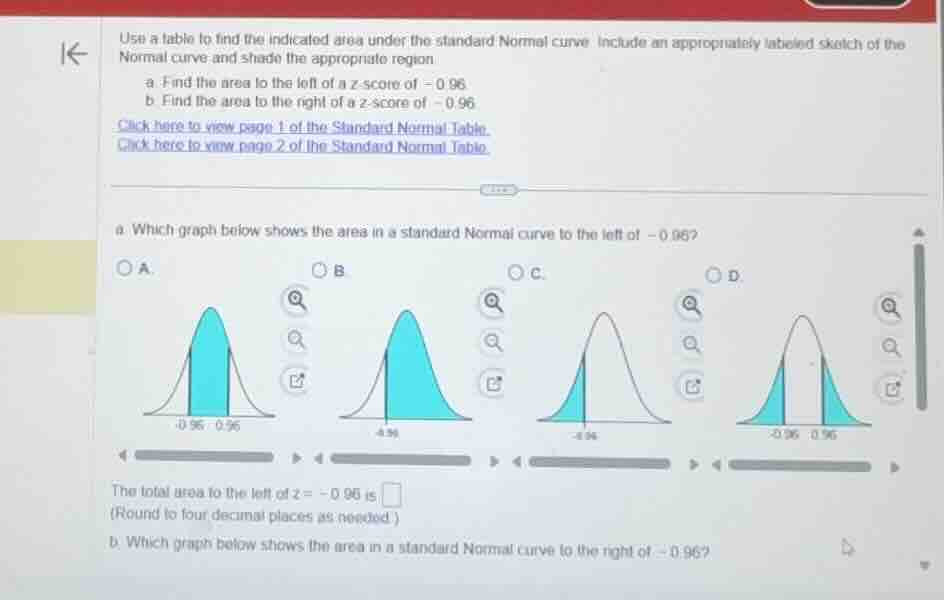
a. which graph below shows the area in a standard normal curve to the left of \\(-0.96\\)?
a. a symmetric bell curve with the region between \\(-0.96\\) and \\(0.96\\) shaded.
b. a symmetric bell curve with the region to the right of \\(-0.96\\) shaded.
c. a symmetric bell curve with the region to the left of \\(-0.96\\) shaded.
d. a symmetric bell curve with the regions to the left of \\(-0.96\\) and to the right of \\(0.96\\) shaded.
the total area to the left of \\(z = -0.96\\) is
(round to four decimal places as needed.)
b. which graph below shows the area in a standard normal curve to the right of \\(-0.96\\)?
🆕 New Concept Discovered: Standard Normal Distribution and Z-Scores
Finding areas under the bell curve
---
Step 1: Identify the correct graph for part (a)
We need to find the graph that represents the area under the standard Normal curve to the left of \( z = -0.96 \).
- A standard Normal curve is centered at \( z = 0 \).
- The value \( z = -0.96 \) is located to the left of the center.
- "To the left of" means we shade the region starting from the far left tail up to the line at \( z = -0.96 \).
Looking at the options:
- A: Shows the area between \( -0.96 \) and \( 0.96 \).
- B: Shows the area to the right of \( -0.96 \).
- C: Shows the area to the left of \( -0.96 \).
- D: Shows the areas in both outer tails (to the left of \( -0.96 \) and to the right of \( 0.96 \)).
Thus, the correct graph is C.
---
Step 2: Find the area to the left of \( z = -0.96 \)
Using a standard Normal probability table (z-table) for negative z-scores:
- Locate the row for \( -0.9 \) on the left side of the table.
- Move across to the column labeled \( 0.06 \).
- The value at the intersection of row \( -0.9 \) and column \( 0.06 \) gives the cumulative area to the left of \( z = -0.96 \).
From the standard Normal table:
---
Step 3: Identify the correct graph for part (b)
We need to find the graph that represents the area under the standard Normal curve to the right of \( z = -0.96 \).
- "To the right of" means we shade the region starting from the line at \( z = -0.96 \) all the way to the far right tail.
- This corresponds to graph B.
---
Step 4: Find the area to the right of \( z = -0.96 \)
The total area under the standard Normal curve is exactly \( 1 \). To find the area to the right, we subtract the area to the left from \( 1 \):
---

Snap & solve any problem in the app
Get step-by-step solutions on Sovi AI
Photo-based solutions with guided steps
Explore more problems and detailed explanations
Part a
- Graph selection: C
- The total area to the left of \( z = -0.96 \):
0.1685
Part b
- Graph selection: B
- The total area to the right of \( z = -0.96 \):
0.8315