QUESTION IMAGE
Question
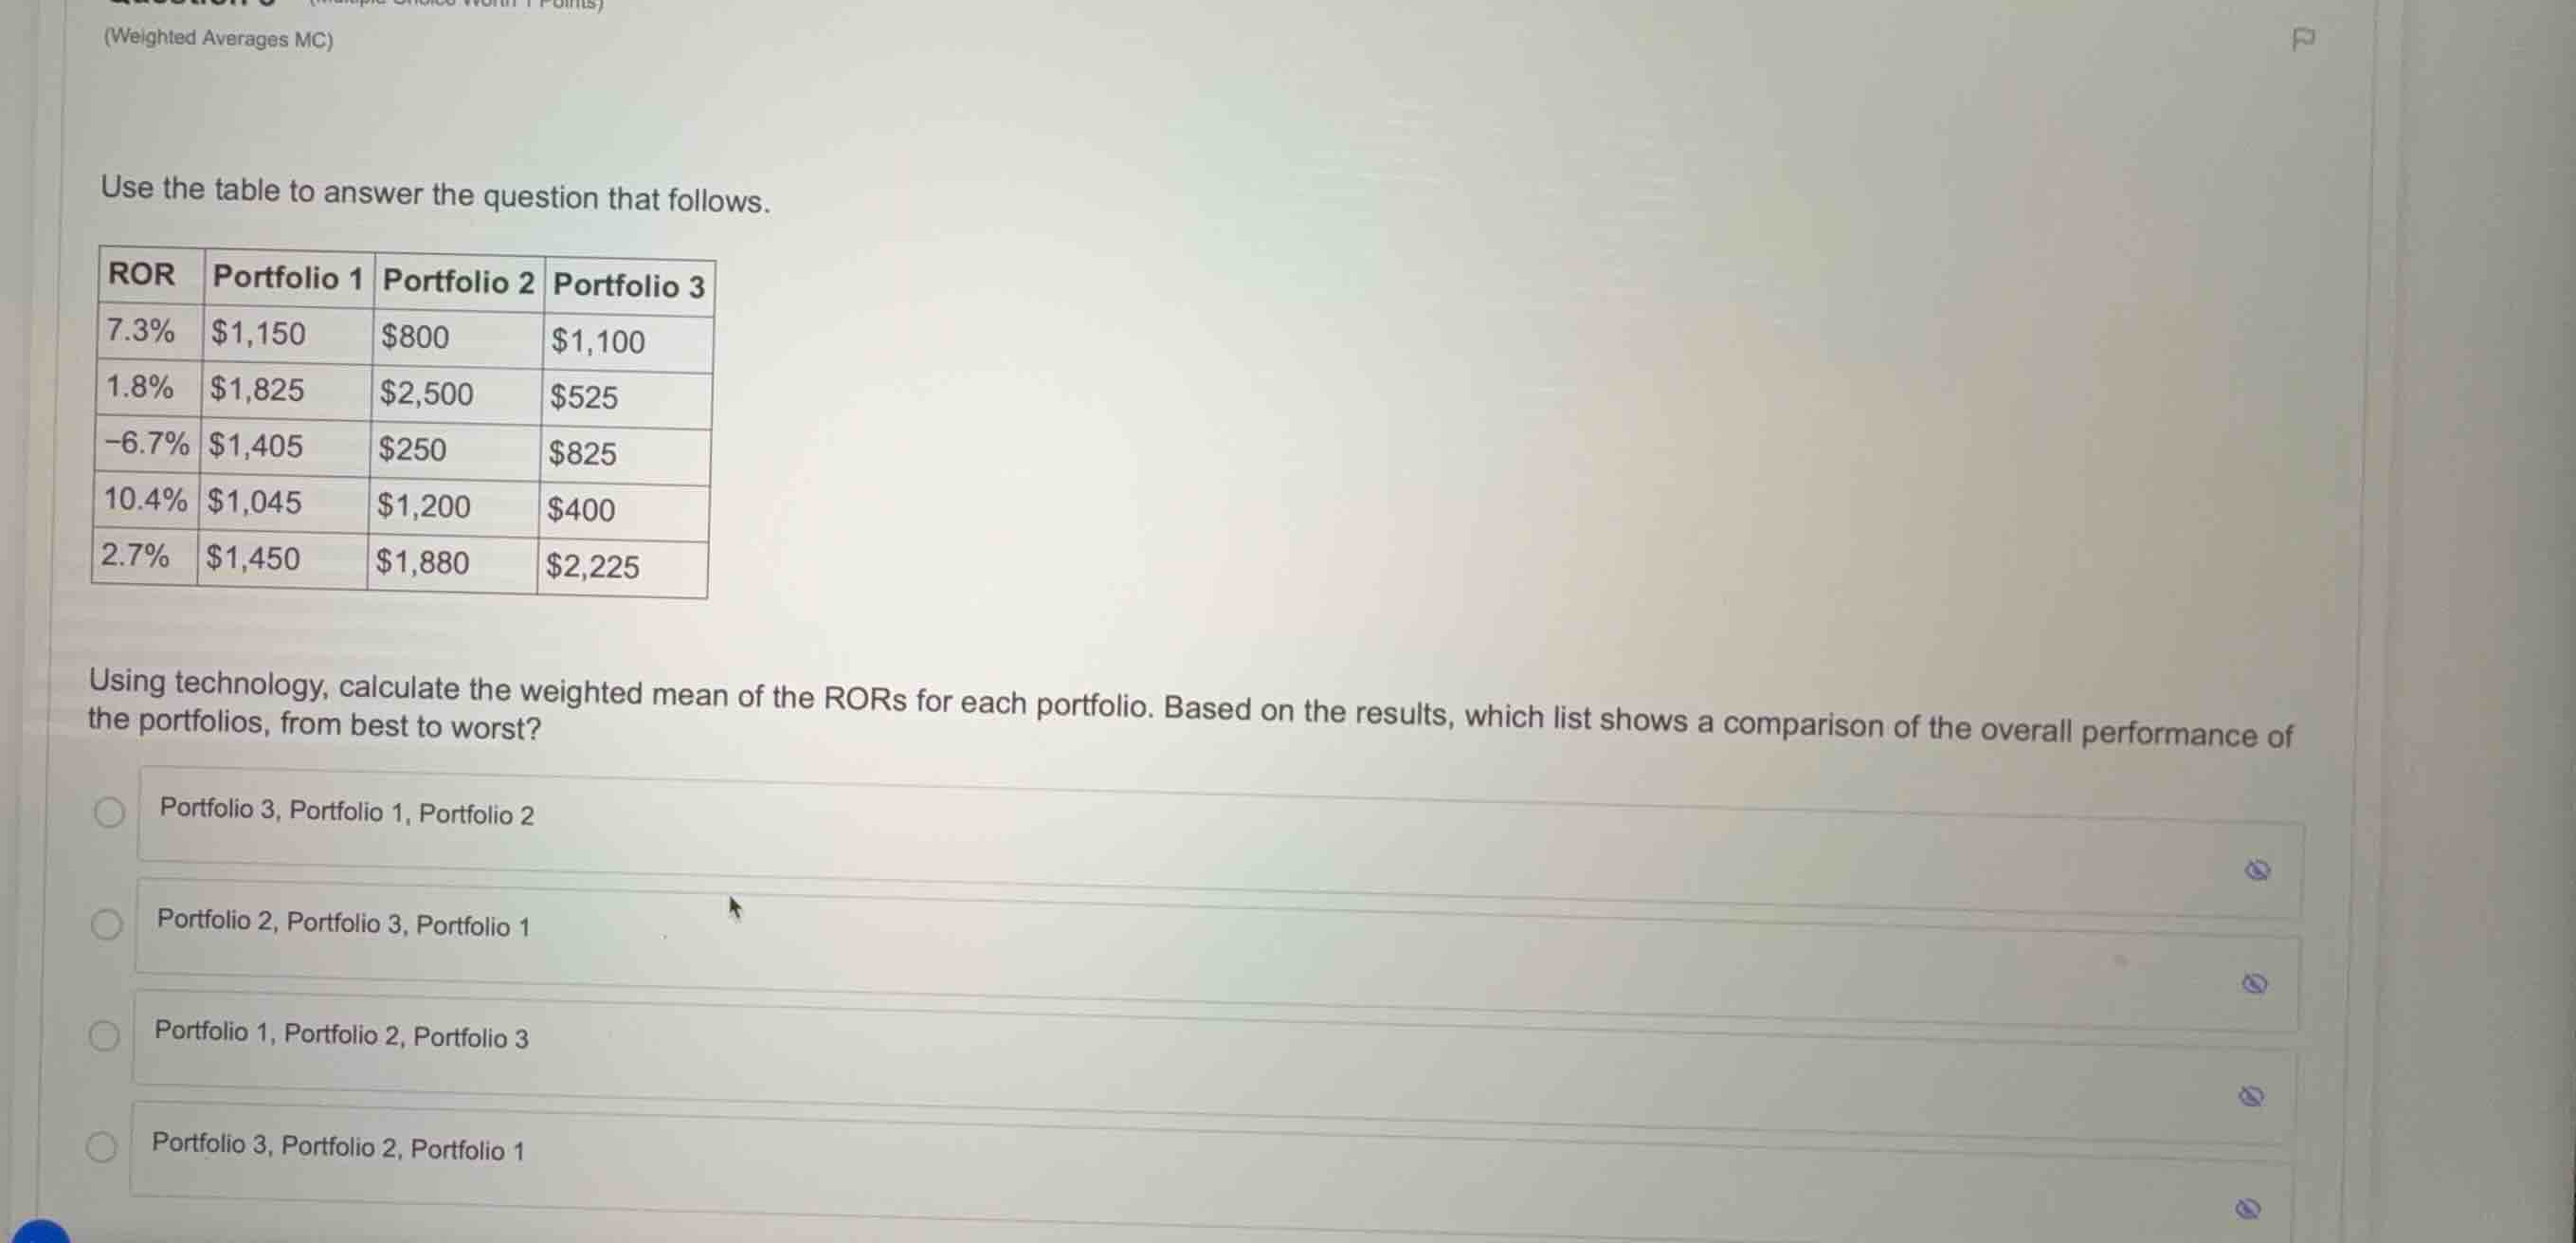
use the table to answer the question that follows.
using technology, calculate the weighted mean of the rors for each portfolio. based on the results, which list shows a comparison of the overall performance of the portfolios, from best to worst?
- portfolio 3, portfolio 1, portfolio 2
- portfolio 2, portfolio 3, portfolio 1
- portfolio 1, portfolio 2, portfolio 3
- portfolio 3, portfolio 2, portfolio 1
Calculate total value of each portfolio
We sum the asset values for each portfolio to find the total investment.
For Portfolio 1:
For Portfolio 2:
For Portfolio 3:
Calculate weighted return for Portfolio 1
We multiply each Rate of Return (ROR) by its corresponding asset value, sum them, and divide by the total value.
Calculate weighted return for Portfolio 2
We repeat the weighted sum calculation for Portfolio 2.
Calculate weighted return for Portfolio 3
We repeat the weighted sum calculation for Portfolio 3.
Compare performance from best to worst
We rank the portfolios based on their weighted mean rates of return.
Comparing the calculated values:
- Portfolio 2: \(3.96\%\) (Best)
- Portfolio 3: \(2.68\%\) (Middle)
- Portfolio 1: \(2.48\%\) (Worst)
Thus, the ranking from best to worst is: Portfolio 2, Portfolio 3, Portfolio 1.

Snap & solve any problem in the app
Get step-by-step solutions on Sovi AI
Photo-based solutions with guided steps
Explore more problems and detailed explanations
- Portfolio 3, Portfolio 1, Portfolio 2
- Portfolio 2, Portfolio 3, Portfolio 1 (Correct answer)
- Portfolio 1, Portfolio 2, Portfolio 3
- Portfolio 3, Portfolio 2, Portfolio 1